
Tidal Currents
Tidal currents are not homogenous; instead the flow within tidal current is a complex interaction of several processes (Okorie et al., 2007). Wave-induced eddies at the sea surface and those created by the seabed (bottom boundary layer) can have a significant effect on the tidal current. The wave current interaction may result in very high and choppy conditions.
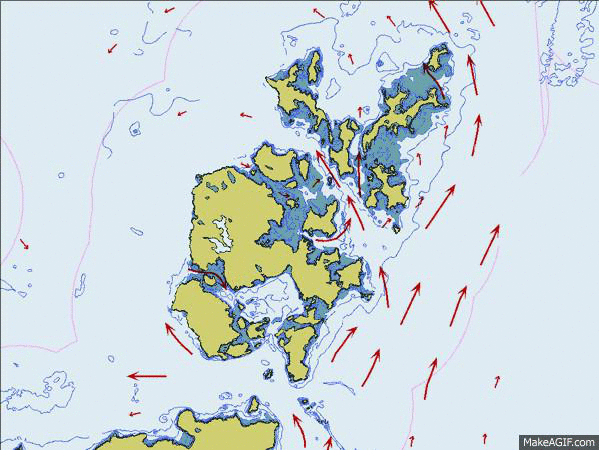
A typical tidal flow variation is illustrated in the animation below (Orkney Marine Service, 2012), which shows the tidal flows around the Orkney Islands, where the European Marine Energy Centre (EMEC) tidal test site is located (in the Fall of Warness).
Wave-Current Interactions
Barltrop et al. (2006) reported that, " wave effects can be ignored if wave flow is small compared with tidal currents. Waves are important if the wave flow speeds are a significant proportion of, or greater than, those of the tidal current, i.e. in extreme weather."An EMEC study (Norris and Droniou, 2007) found that for waters of a depth of approximately fifty-five metres the wave effects could penetrate to a depth of fifteen metres and the bottom boundary layer effect as far as thirty metres above the seafloor. This leaves a narrow window of operation of approximately ten metres in an overall fifty five metre depth of water. Another interesting finding was that turbulence increases in slow moving tidal streams, which is slightly counter-intuitive.
As the animation below (Russell, 2011) illustrates, wave effects reduce with water depth. If the device can be maintained at an appropriate depth then the wave-induced water particle velocities will be greatly reduced.

Velocity Profile
The vertical velocity profile of a tidal current is made up of a complex interaction of the diurnally and bi-monthly varying tidal flow, wind-driven surface wave, the bottom boundary layer and turbulent eddies, operating over varying time and length scales. In order to simplify these complex interactions, the vertical velocity profile is assumed to follow the 1/7th power law turbulent velocity profile, which " originally estimated from pipe flow data, provided and continues to provide a simple but effective relationship for turbulent mean velocity profiles " (De Chant, 2005). The chart below shows the vertical velocity profile, according to the 1/7th power law, as well as the power available to the turbine in this flow.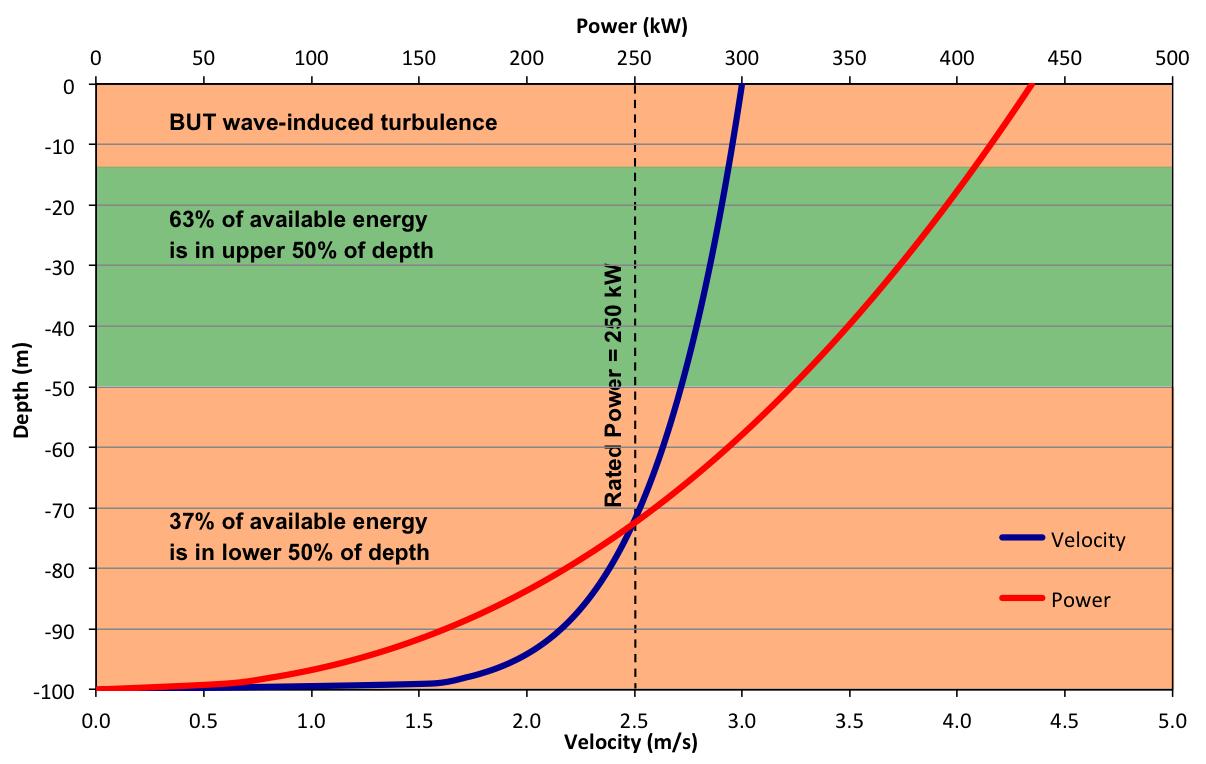
Detailed Site Data
Potential sites will require a significant amount of preliminary data collection prior to any installation. The prevailing environmental conditions of a site will need to be well known if a cost effective design solution is to be deployed.The operating environment and its interaction with the mooring system will influence the structural loading and performance characteristics imposed upon it. This will need to include the effect of turbulent flow but this is notoriously difficult to model.
Efforts continue to accurately model dynamic turbulent flow but to-date no definitive solution exists. For this reason, while this design acknowledges dynamic turbulent flow it models it as a linear effect.