


COP Regression
As well as all heat pumps, the performances of the Sanyo CO2 heat pump are dependent on 2 main parameters:
- the outside temperature
- the return temperature from the gas cooler
We studied the variations of these parameters in our EES model and the experimental results confirm the trend of these curves. It was then possible to estimate the COP of the Heat pump by doing a multiple regressions of the curves in function of these 2 parameters.
Data used for Regression
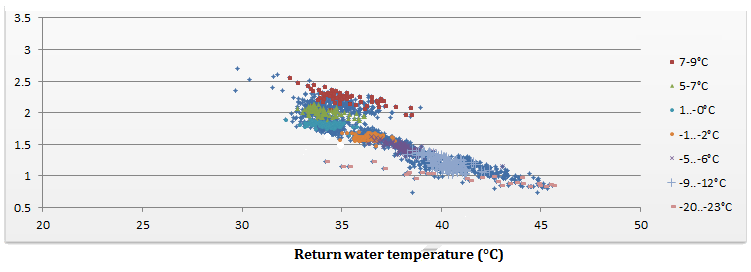
With the tests realized at the KTH universities, the graph of the COP in function of the outside temperature and return water temperature to the heat pump has been realized. We also added to the graph all the measurement of COP made in the report. The following graph show all the points that we used for our regression.
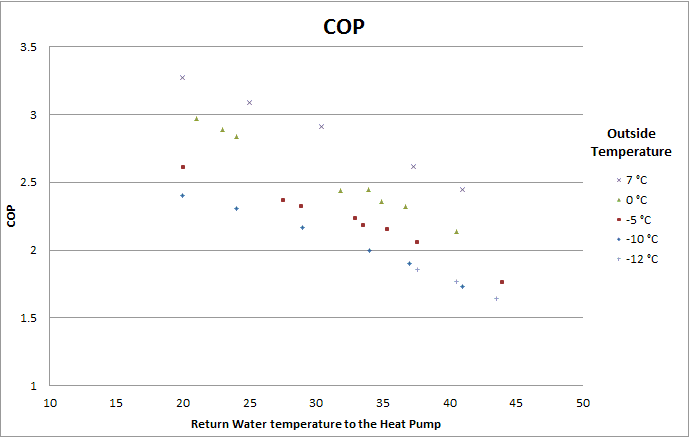
Experimental Data (KTH Report) of the COP in function of the water return temperature to the Heat Pump.
Choice of the parameters and results
The COP seems to vary linearly with the return water temperature to the gas cooler. In our simulations, the curves were slightly curved but linear variations will be considered in this case. Higher degree of exponent for this parameter does not indeed bring any improvement.
In our EES simulations, the COP was not totally linear in function of the outside temperature but they were slightly curved. So the COP was expressed in function of the outside temperature and the square of the outside temperature.
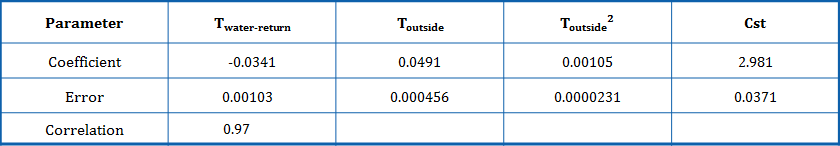
Some other combinations of parameters have been tried, but no real improvements in the coefficient of correlation have been noticed. The COP was therefore expressed in function of the return water temperature to the heat pump, the outside temperature and the square of the outside temperature.
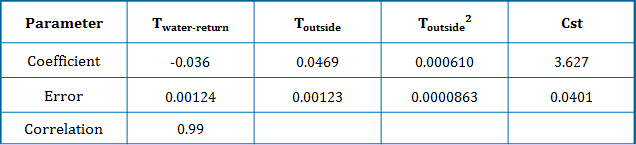
The multiple regressions realized in Microsoft excel gave the following results:
Validation of the Regression with the Data from the Finnish case study
In order to test the validity of the regression, the data from the Finnish case study have been studied. However, the main data collected have been made before the change made to improve the monitoring (more information are available: here). As mentioned on this page, the absolute values of the COP are not exact since the water flow meter was not initially calibrated and the temperature sensors were outside the pipes. However, it was interesting to look at the coefficient (slope) for each parameter.
The data for the month of October 2010 to February 2011 have been considered. It was first necessary to process the data to consider only the situations where the heat pump was working in steady conditions. The different steps that were followed are described on the diagram below.
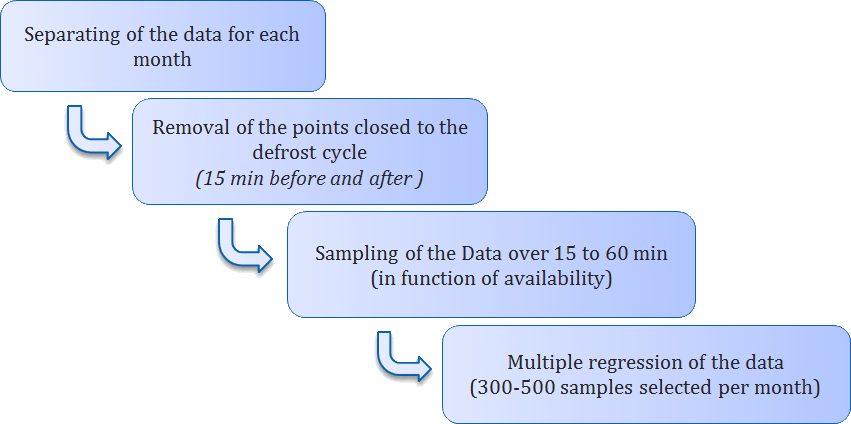
Finally, around 1800 points were considered to draw the following graphs:
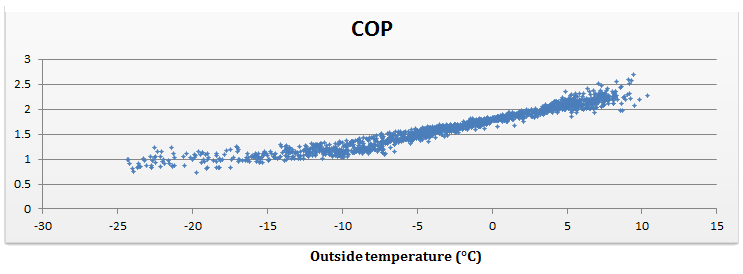
The trends of the curves are the expected one. It can however be noticed that the return temperature to the heat pump tends to be quite constant at a given outside temperature. Finally the regression of these curves gives the following results:
We can notice that except for the constant, the coefficients calculated are quite close to the previous one. The difference is however a bit more significant for the square of the outside temperature. For the first regression, the error for this parameter was quite high, which question its validity. It suggests that the coefficient might be a bit higher in reality.
Thus the study of the first Finnish data tends to confirm the coefficient value of our regression. A few tests with the new data available (after the calibration) enabled to confirm the regression. A more detail analysis of these new data could however been made to bring a better confirmation.
Conclusion
This regression of the COP in function of the return temperature to the gas cooler and the outside temperature give a quite good correlation with the data.
However it can be noticed that it has been realized with the data of the 4.5 kW heat pump. We will extend its use to the 9kW Heat pump which has the same performances according to the manufacturer. However no real measurement of the COP for the 9 kW has been effectively done.
The regression will be used for the analysis of the monitoring data and could also be used for a simple dynamic model of the heat pump.