Eaglesham Heat Demand
Eaglesham’s primary building type is domestic properties, with only one school and two pubs to complement them. As this site turned out to be a bit of a data desert it was decided to construct a gas usage data set from boiler timings and degree day data.
The boiler timings for the school are optimised for day usage with the pubs covering licensing hours.
| Month | Jan | Feb | Mar | Apr | May | Jun | Jul | Aug | Sep | Oct | Nov | Dec |
| Peak Supply (kW gas CV supplied) | 23964 | 18156 | 14869 | 12013 | 10280 | 4932 | 2692 | 2080 | 6639 | 11748 | 13468 | 19152 |
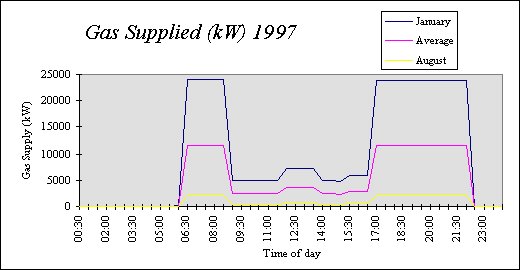
It is quite easy to see that domestic use swamps the non-domestic 5:1 but the range of the seasonal variation is huge from February’s 24 MW(gas CV supplied) peak down to August’s 2 MW(gas CV supplied).
While this technique is far from perfect it is sufficient, considering the time limitations, for the purposes of this project. If a study were to be undertaken a long term monitoring program would have to be put into place.
Back to Top