University Heat Demand
Unlike the electricity data we were not blessed with the luck to find the local high pressure gas main logged half hourly. Fortunately the Estates Department have a policy of recording all meter readings on a Friday afternoon. Another factor was that the John St. Steam Boilers, Students’ Union and swimming boilers were all fed from separate gas mains.It was not possible to remotely or manually log these meters due to safety considerations.
| The project required half-hourly/hourly data. Initially it was hoped that the Steam flow meters within the boiler house would prove accurate enough to extract high quality data from. Upon further investigation it was found that these meters "stuck open" and suffered from unacceptable lag and errors. This meant deriving data from the time clock operation. All the boilers including the steam boilers (15,000 + 25,000 lbs/hr) are on/off devices so by deciding when they were allowed to fire (time clocks for the S.U. and swimming pool, manual for the steam plant) a daily average of gas use/heat produced could be calculated. | 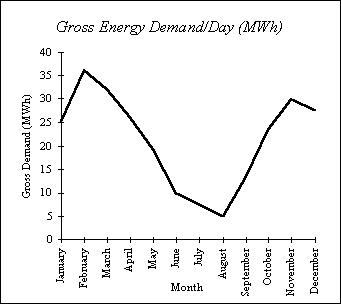 |
| Year 1997 | Jan | Feb | Mar | Apr | May | Jun | Jul | Aug | Sep | Oct | Nov | Dec |
| Gross Energy Demand/day (MWhrs) | 25.3 | 36 | 32 | 26 | 19.25 | 9.9 | 7.5 | 5 | 13.4 | 23.6 | 29.9 | 27.4 |
Boiler efficiencies for the hot water boilers were known and guestimated for the steam plant.
Back to Top
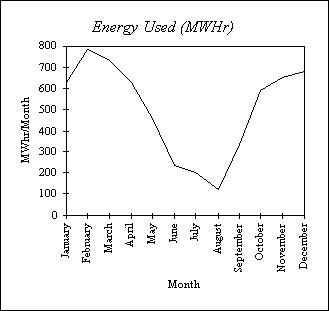
| Year 1997 | Jan | Feb | Mar | Apr | May | Jun | Jul | Aug | Sep | Oct | Nov | Dec |
| Gross Monthly Energy Usage (MWhrs | 627 | 785 | 735 | 628 | 461 | 237 | 199 | 120 | 334 | 590 | 652 | 680 |
As there is different usage over the weekends, with the steam plant
predominantly off (unless frost protection is required).
Back to Top
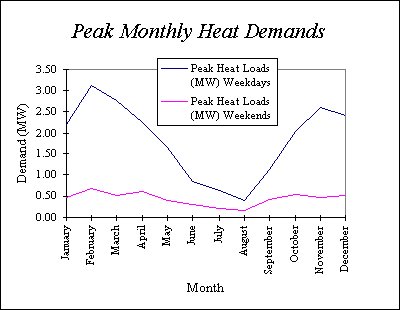
| Peak Heat Loads (MW) | Jan | Feb | Mar | Apr | May | Jun | Jul | Aug | Sep | Oct | Nov | Dec |
| Weekdays | 2.21 | 3.12 | 2.77 | 2.26 | 1.66 | 0.83 | 0.63 | 0.42 | 1.13 | 2.04 | 2.58 | 2.39 |
| Weekends | 0.49 | 0.68 | 0.53 | 0.60 | 0.41 | 0.31 | 0.23 | 0.17 | 0.44 | 0.55 | 0.48 | 0.53 |
Back to Top
| Developing profile shapes to take into account seasons, plant size and accommodation use. | 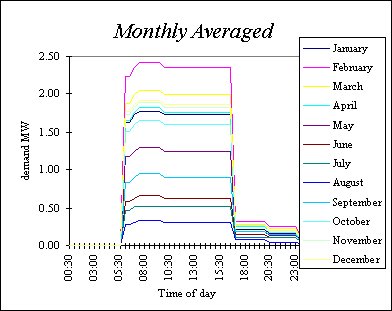 |
Back to Top
Degree Days Analysis
A quite common technique in apportioning energy use is to relate it to the degree days of the
environment. We are quite fortunate in that the vast majority of the gas use is for heating
(the chemists barely touch the stuff and there are no kitchens).
| The initial plot of heat use against degree days produced a rather inaccurate result due to the unusual building usage in December/January. If these months are neglected the adjacent graph is produced. The line of best fit should be the energy use per degree day formula. |  |
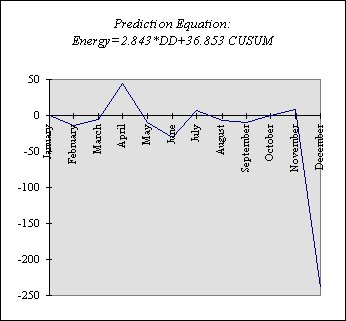 |
To see how well the University conforms with this formula a CUSUM analysis was completed. It can be seen that with the exception of December (due to Christmas closure) the site behaves as it should, therefore the equation holds true. |
Back to Top