Results
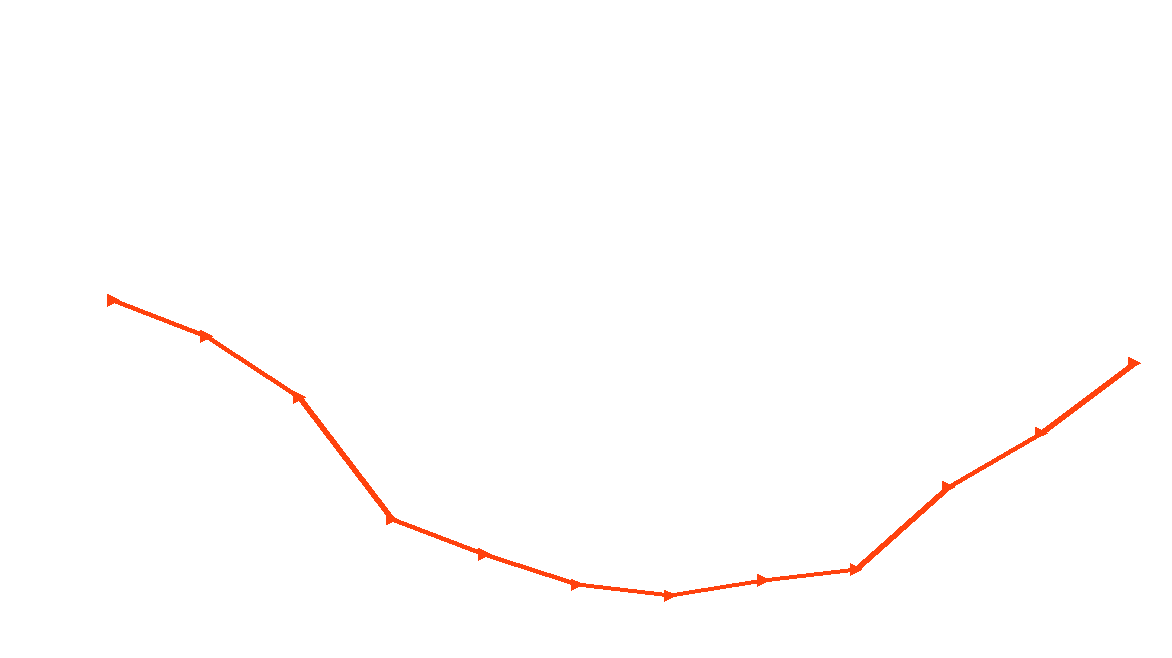
The graphs below show the resulting carbon emissions over the year 2018 as modelled in energyPRO for the scenarios examined.
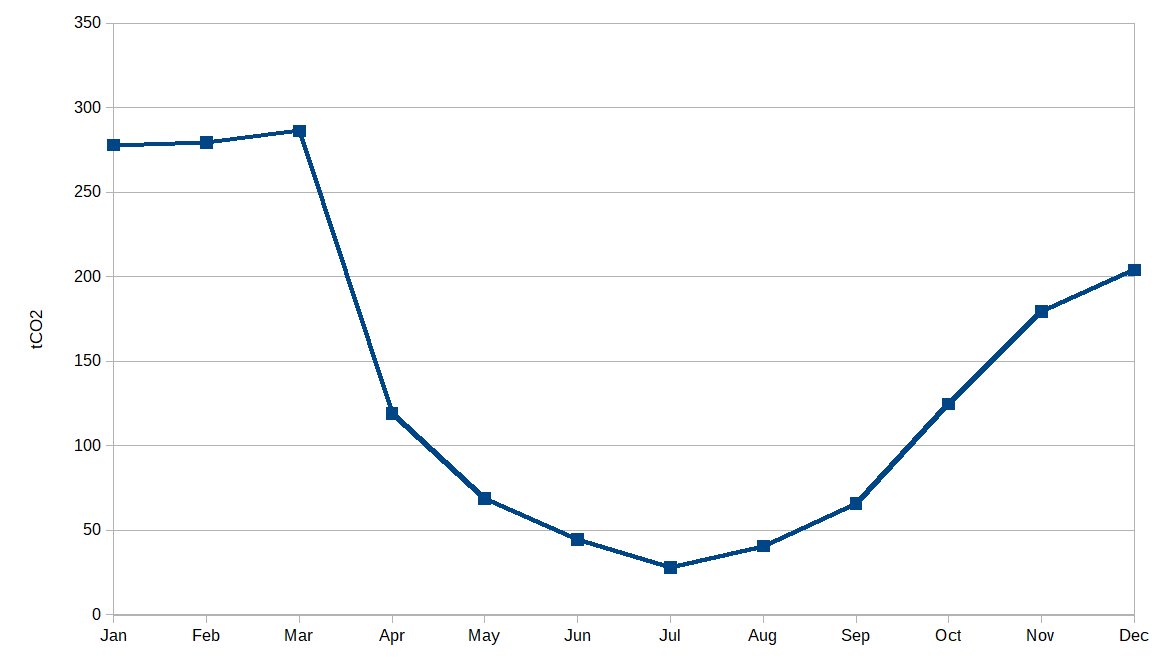
Queens Quay Baseline scenario CO2 output: 1719tCO2
Clean Heat Vision scenario CO2 output: 28.87tCO2
Reduction: 98.3%
Use the controls below to examine how the different features of the scenarios affect the CO2 output:
Scenario
(QQB)
(CHV)
Demand profile
Renewable energy
Thermal store
Note the peak that the "Beast from the East" makes in the March data. During this period thermal demand is high, and as previously seen the grid carbon intensity is also high. However, due to the high winds associated with the concurrent Storm Emma, this peak is removed when local renewables are incorporated into the model.
The energy requirement of each scenario was as follows:
| QQB | CHV | Reduction | |
|---|---|---|---|
| Annual thermal energy demand | 19790MWh | 6328MWh | 13462MWh (68%) |
| Annual electrical energy demand | 6219MWh | 1320MWh | 4899MWh (79%) |
| Annual grid electricity intake | 6219MWh (100% of demand) | 145.3MWh (10.9% of demand) | 6073MWh (98%) |
Sensitivity Analysis
In order to more closely examine the relative impacts and interdependence of the aspects of each scenario a sensitivity analysis was carried out. Three aspects were examined:
Wind capacity - as a starting point the scenario assumed access to the 'spill wind' of ten turbines at Whitelee wind farm. Is this level of capacity needed?
Thermal store capacity - the thermal store was sized to meet one week's thermal demand in every case.
Spill wind threshold - the scenario begins to draw 'spill wind' from the turbines when they're running at 75% of capacity. Raising this will reduce the amount and increase the intermittency.
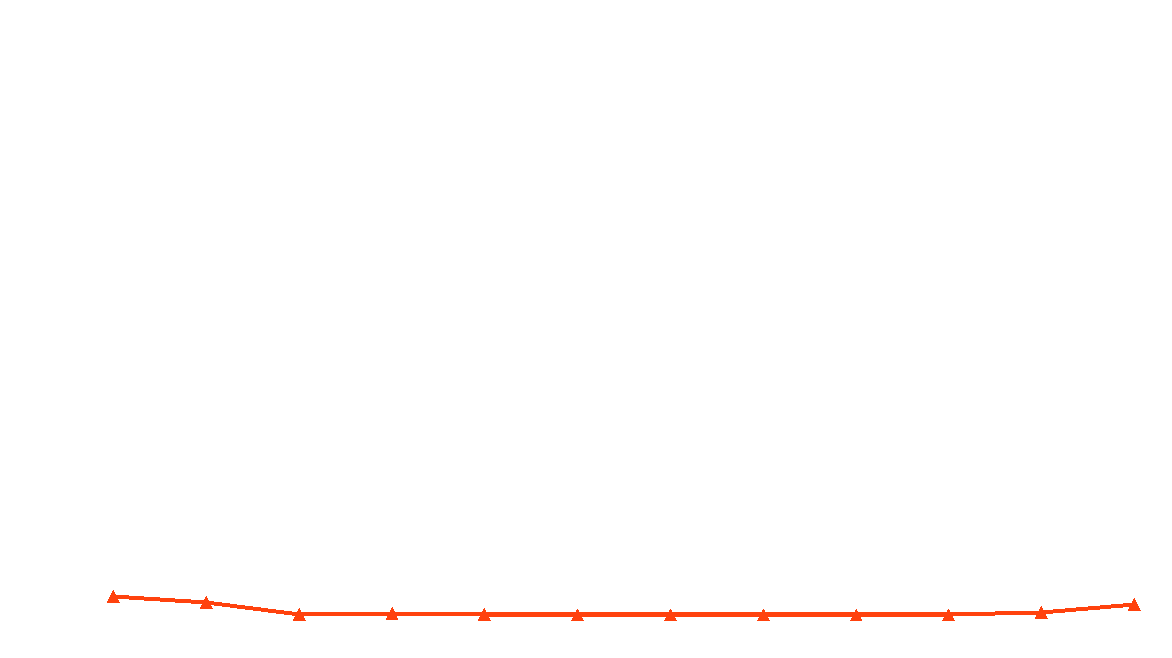
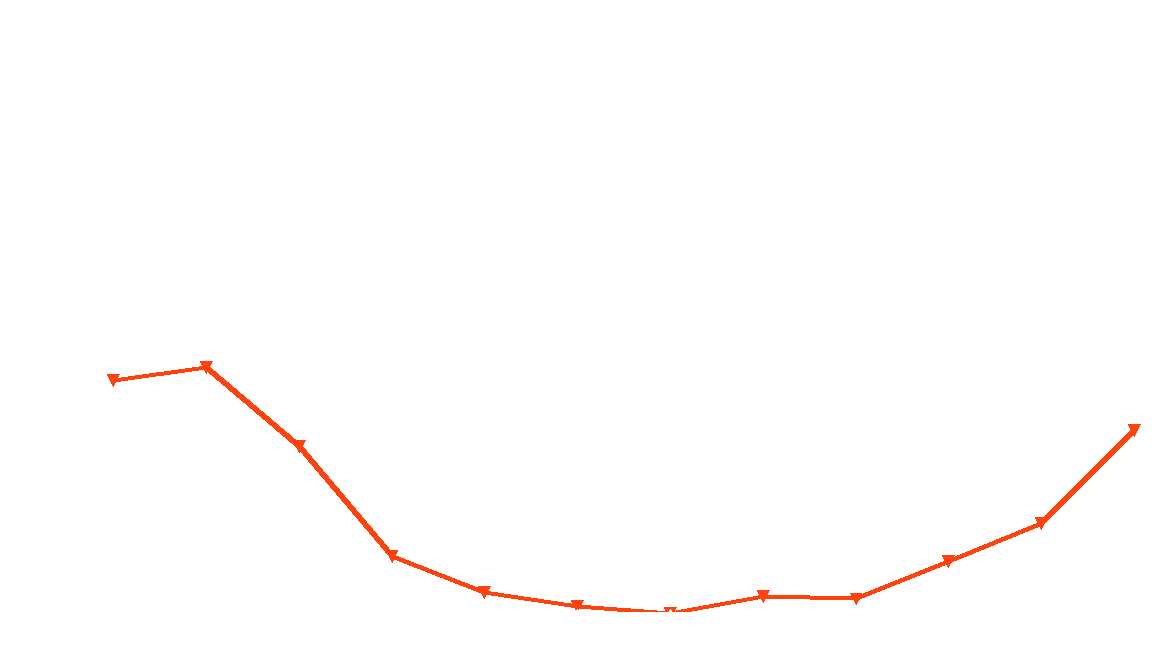
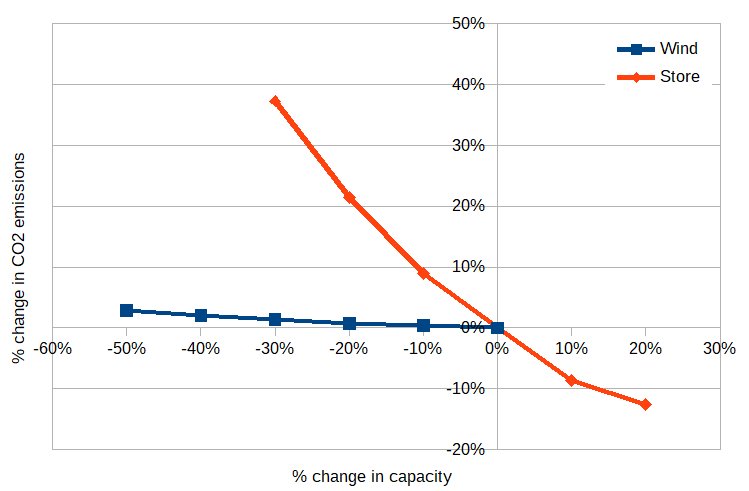
Sensitivity to wind and thermal store capacities
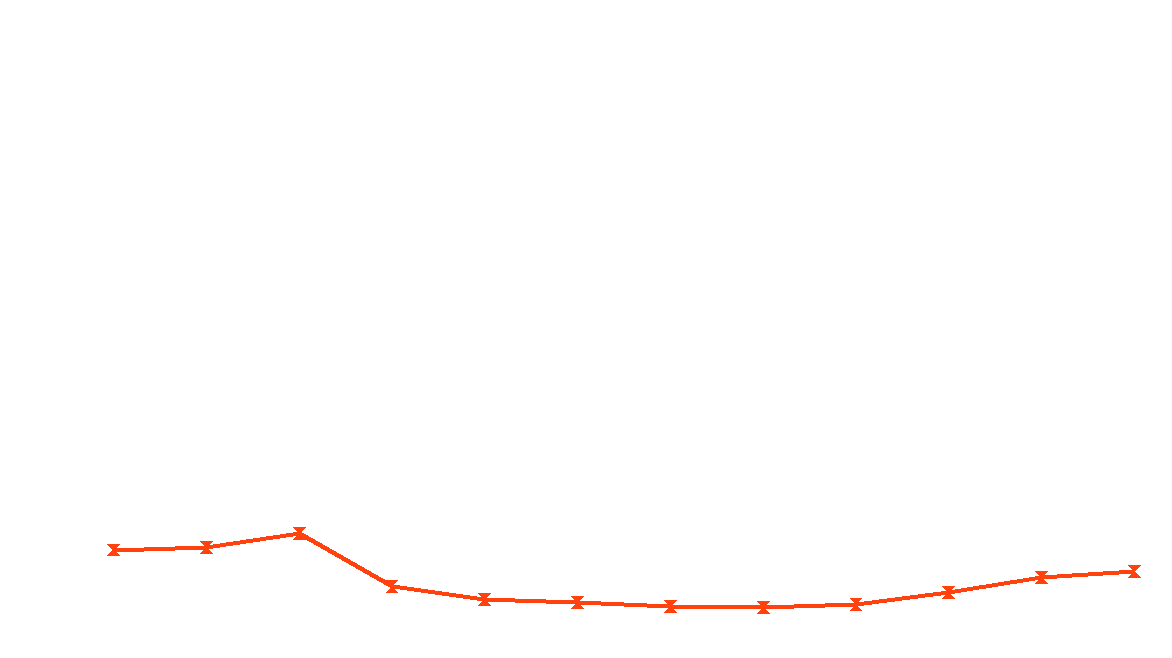
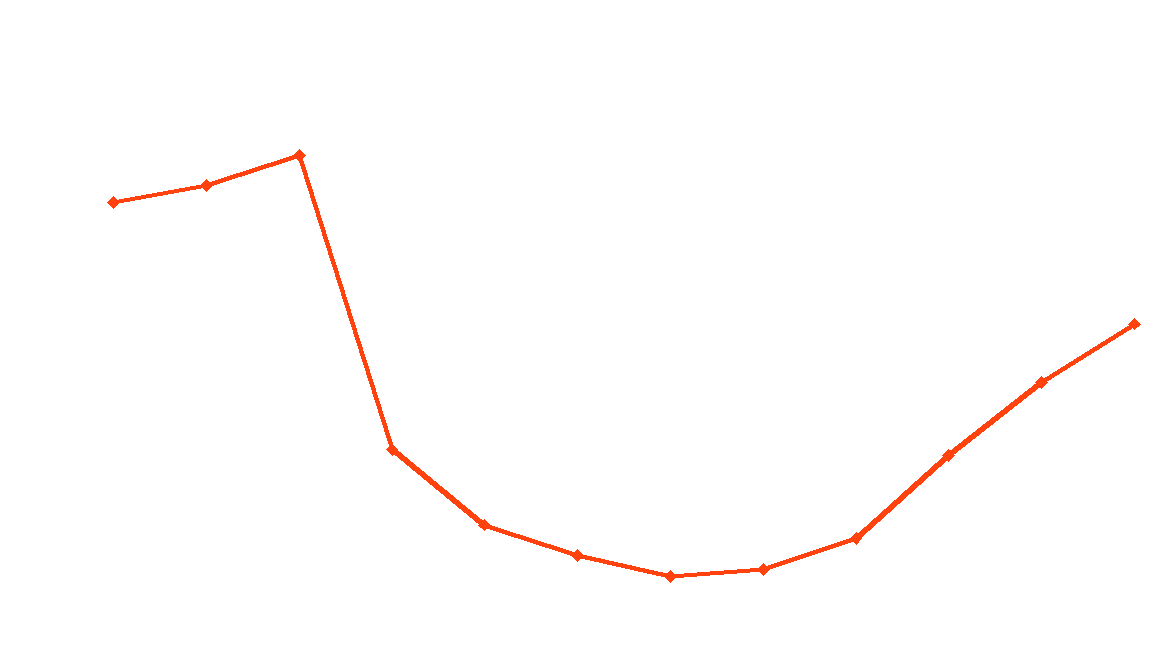
Sensitivity to spill wind threshold
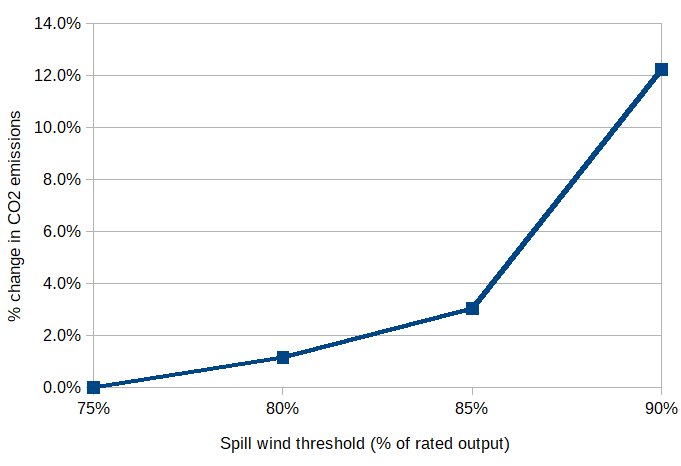
From this analysis it can clearly be seen that, as might be expected, the wind energy is so abundant and large compared to the size of the demand that varying it even by 50% has little impact on the carbon intensity of the heating system. Less obvious is the imapct that changing the 'spill' threshold has. Increasing this threshold will not only reduce the amount of power delivered from the turbines but also result in periods of 'spill' wind becoming shorter, fewer and farther between. The effect of this becomes pronounced by the time the threshold is being set at 90%.
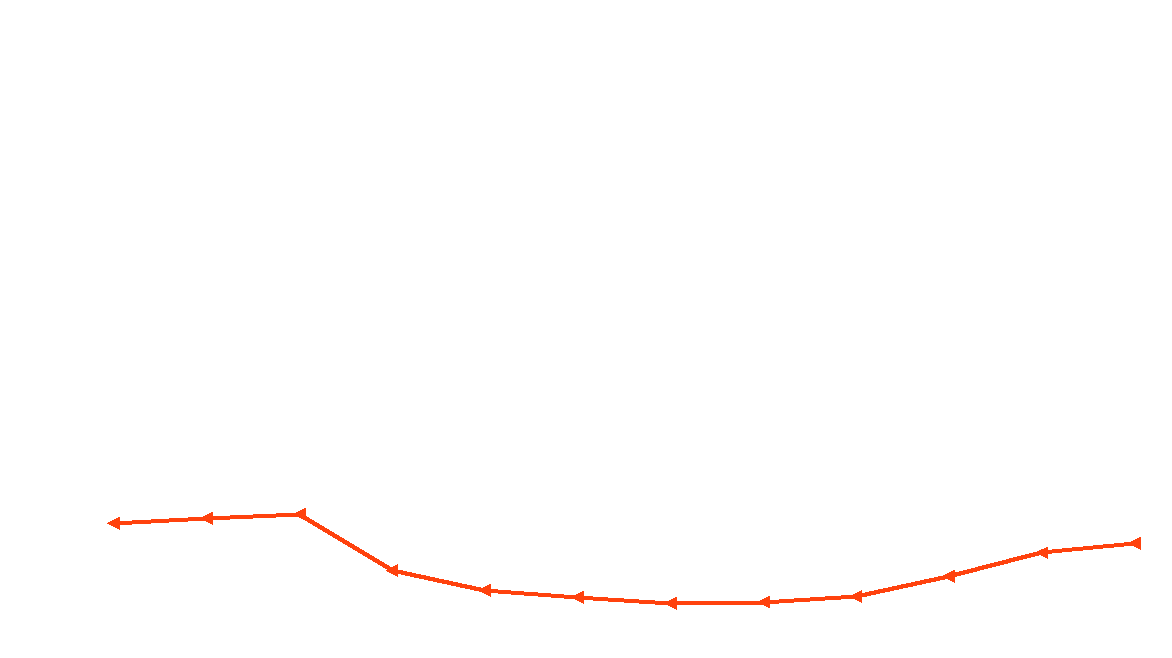
Thermal losses
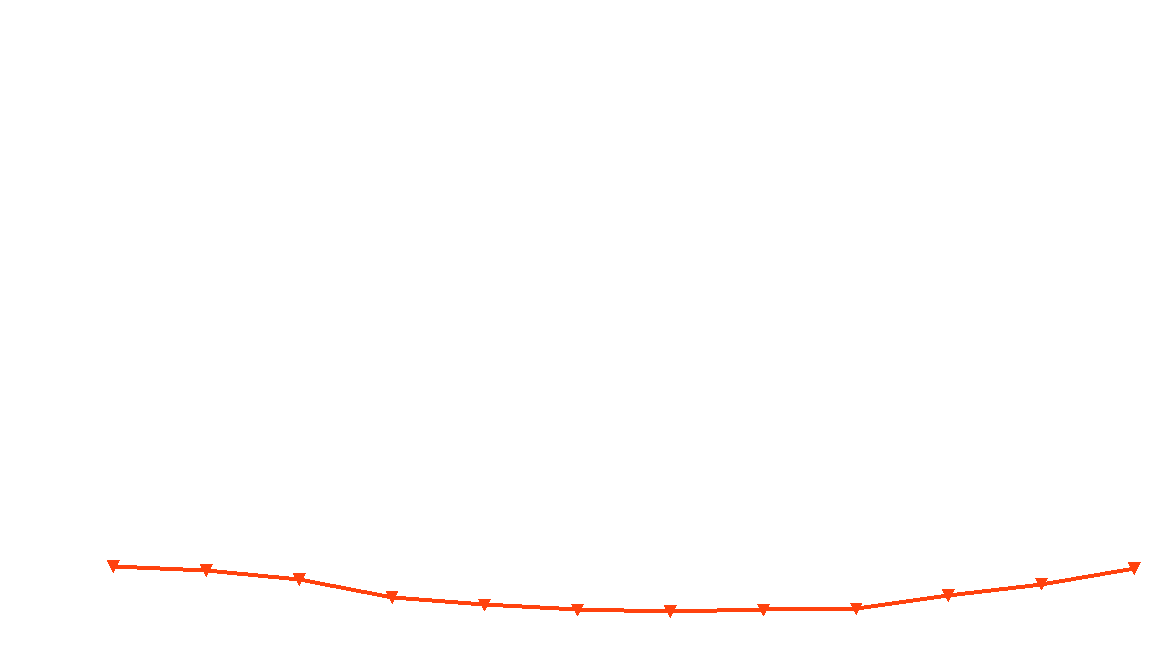
energyPRO provides an approximate estimation of the thermal losses from the heat store, based on a given level of insulation (in our case, 300mm of mineral wool) and the ambient air temperature series. Combining these losses with those already calculated for the heating network, the total losses over the year are only 233MWh.
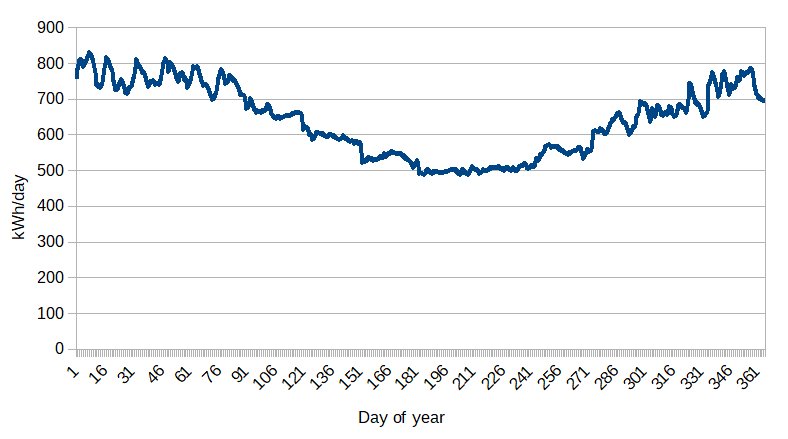
Daily thermal losses over the year modelled