

KAPLAN TURBINE
With an average tidal range of 5m, our barrage system will have a small hydrodynamic head. The hydrodynamic head is in our case the difference between the water level inside and outside the basin. The hydrodynamic head has a major impact on the power production potential. The simplified tidal barrage system will have continuous, bidirectional flow through the turbines. A Kaplan Turbine is able to operate under the above described requirements:
- low hydrodynamic head
- bidirectional flow
- large flow rates
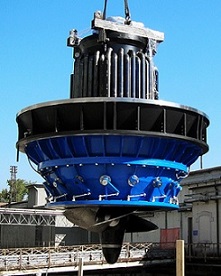
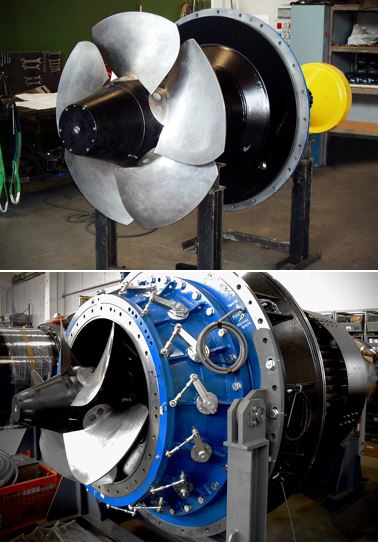
A Kaplan Turbine is similar to a ship propeller. Instead of using mechanical energy to generate axial thrust and motion, the turbine is driven by the force of the water flow to generate mechanical energy, and with the aid of an accompanied generator electrical energy. A Kaplan turbine has adjustable blades to accompany changing heads and flow rates, securing optimum power output. Generally, there are different options to regulate a Kaplan turbine. If the turbine is not regulated, it is called a propeller turbine. Such a turbine is used when the head and flow rate is constant. If the runner blades are adjustable, the turbine is a single regulated Kaplan. This adjustment allows to adapt the turbine when the head and flow rate varies in order to increase part load efficiency. A doubled regulated Kaplan uses also the vanes to adjust the system.
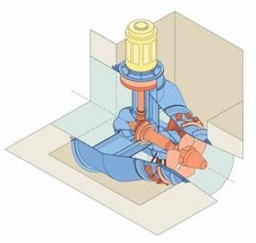
For small scale hydro schemes the compactness of the system to allow smaller turbine runner diameters is also very important. A smaller turbine runner has a higher rotation speed, which has advantages for the generator unit. The following options are broadly available for small scale hydro sites. A belt driven or a bevel gear bulb turbine allows to move the generator on top of the turbine unit, which reduces the size of the turbine housing compared to a conventional bulb turbine where the generator is positioned inside the turbines. There is also an option to use a conventional bulb turbine as a compact version with a permanent magnet generator PMG.
Belt driven Kaplan Turbine
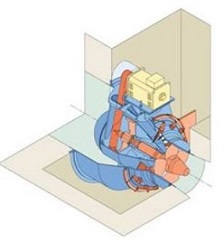
Conventional bulb with PMG
Bevel gear Kaplan Turbine
Generator
There are two different options to couple turbine and generator shaft: direct drive or coupled with a gearbox. A gearbox increases the speed of the generator which reduces size. A slow rotating generator requires a larger number of magnetic poles to deliver the grid frequency of 50Hz, which increases the diameter of the generator runner.
This is described by:

Therefore a generator with a nominal speed of 250rpm requires 24 poles, but a generator with a speed of 167rpm needs 36 poles (VOITH hydro). In general direct coupling is favourable, since it does not require a gear box that would add more complexity to the system. A gear box has the following disadvantages:
- Added losses up to 5%
- Investment and O&M costs
- Vibration and Noise
However, for small head hydro applications it is sometimes more viable (and less expensive) to use a gearbox to reduce the size of the generator. This can help to make a project feasible. A gear box is normally not required, if the rotation speed of the turbine runner reaches approximately 250rpm (J.L. Gordon 2003).
TIME STEPPING METHOD
Theory
Our group developed a model which is based on a time step theory. With the model it is possible to estimate the optimum tunnel diameter to calculate the power output and the water level behaviour inside the basin. If you are interested, you can download the model here: Tidal Barrage Calculation spread sheet and do your own calculations. The following values are necessary for the calculation.
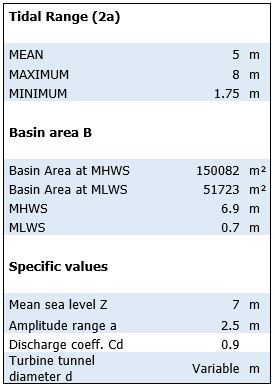
The calculation of Z1, which is the Sea water level outside the basin, is done with the following equation. Z1 is described by a sinus function. A is half the tidal range, t the time step which is 5 minutes in our model and ω which is defined by the length of the tidal cycle which is 12,5h. Z – the mean sea level – is 7m.

Velocity through the turbine is given by:
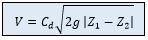
A constant discharge coefficient Cd of 0.9 has been chosen for an optimized, stream lined duct without an operating turbine. The discharge coefficient describes the relation real discharge and theoretical possible discharge. The volume flow rate through the turbine is calculated by:

To define the water level change dz inside the basin the following equation is used:
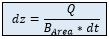
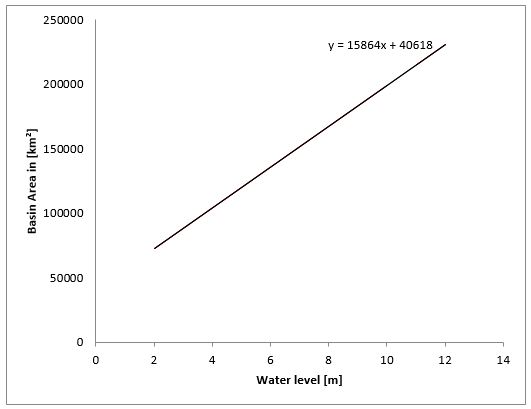
A linear function to describe the fact that the basin area changes over a tidal is cycle is developed as well. This has been done using the values of the MHWS Basin area as maximum water level and the MLWS Basin area as minimum water level. The Basin area will change between these to values with respect to the water level in the basin.
From there it is possible to estimate the new basin water level:

The power can be calculated as follows:
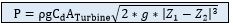
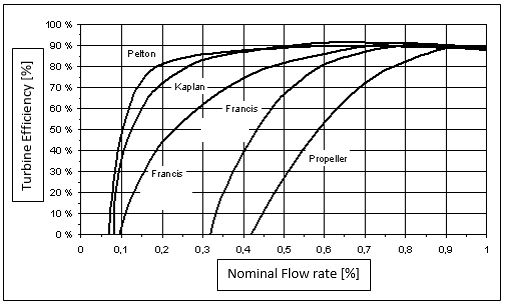
The power output is then multiplied by different efficiency rates for the turbine ηturb, the transmission ηtr and the generator ηgen. A transmission efficiency of 67% and a turbine and generator unit efficiency from 60-90% which is common for small hydro power plants is assumed. The efficiency of the turbine varies, since the flow rate and head are not constant. A turbine is normally designed for a specific band of operation to keep the efficiency constant for different flow rates. However, reaching a certain condition the efficiency will drop rapidly. In conventional hydro power, Kaplan turbine efficiencies start to drop at 50% of the nominal flow.
In a tidal barrage this effect is even increased, since the maximum head is just reached for a short period of time and, when the system reaches a very low head, cross flows through the turbine tunnel are expected. Therefore the efficiency of the turbine and generator is assumed to be 90% at peak power and 70% for an annual average power output. Additional losses due to transformation, gear boxes or downtime are not considered. The total power for one tidal cycle can be estimated by adding all time steps used for one cycle (150 time steps) and an annual power output is calculated for 701 tidal cycles per year.
Flood Risk
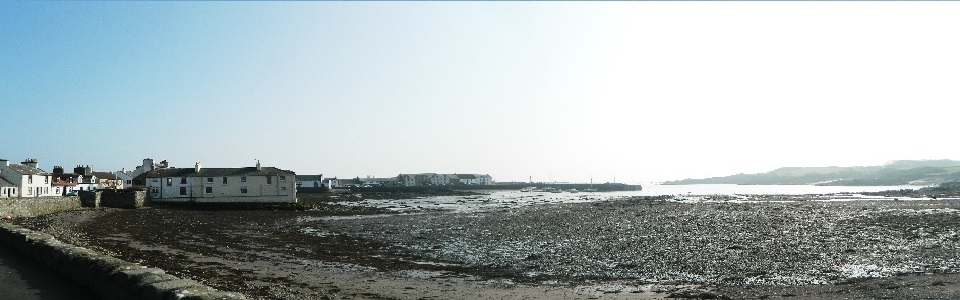
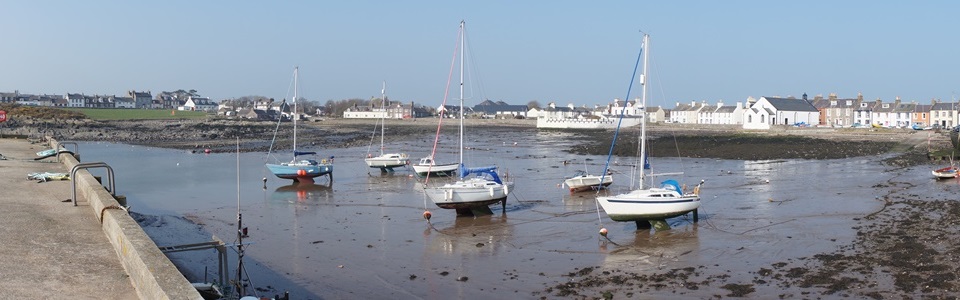
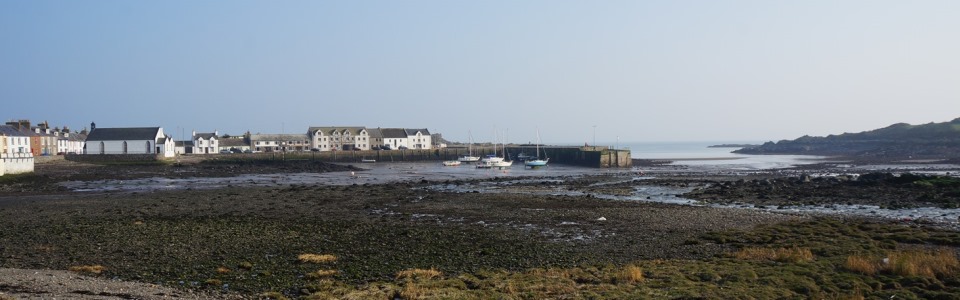
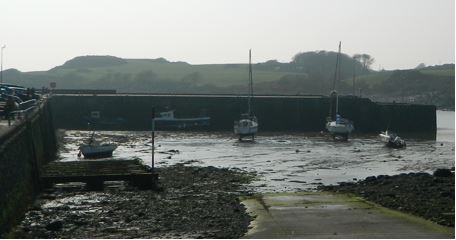
Our main objective is to reduce the flood risk for the village. Therefore, it must be ensured that during a storm there is no risk of flooding with the current cross sectional area of the turbine tunnels. According to the bathymetry data taken in February 2013 the mean sea level at the harbour jetty is 2m and at the harbour row 4m. However, having visited the village in March 2015, the mean sea level at the harbour row is more likely to be 2m as well due to sand deposits. During spring tides the front part of the jetty, which has a total height of 5m from the seabed, is normally flooded. The rear part of the jetty and the harbour row wall have been assumed to be 6m high.
During a storm the mean sea level is going to rise due to the low atmospheric pressure. This additional elevation has been assumed to be 1m. Therefore, the current sea level Z could rise from 7m up to 8m. The tidal range needs to be added on top of the new sea level, which leads to a maximum water level outside the basin of 12m: 8m + 4m (maximum tidal range is 8m). We found that the optimal turbine tunnel diameter regarding the water level behaviour ranges between 2.6m to 2.8m. To ensure that the harbour is not in danger of flooding the tidal ranges inside the basin are calculated.
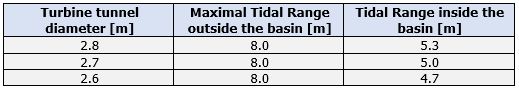
Generally, the barrage reduces the tidal range by about 3m. At the current conditions the overall water level at the harbour row will be about 5.5m. In conclusion, the harbour row which is 6m high will not be overtopped by water.
TURBINE TUNNEL
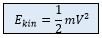
However, right now the model describes just the optimum tunnel diameter for a stream lined duct without an operating turbine. The turbine adds more resistance to the flow. The flow rate and velocity through the tunnel decreases respectively with an operating turbine in place. Since the kinetic energy depends on the flow velocity, it reduces and vice versa.
At maximum power generation condition losses due to friction and turbulence are 1/3 of the total energy available.
Applying the Bernoulli equation the mean velocity for a duct with a turbine and without a turbine can be calculated. Transmission efficiency through the duct with an operating turbine is 2/3 due to losses cuased by friciton and turbulences. Therefore, the veloctiy through the turbine tunnel is reduced.
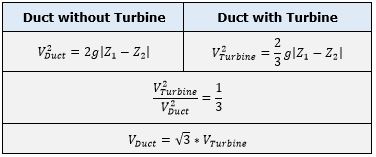
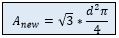
To ensure the same flow rate and power output the cross-sectional area of the turbine tunnel needs to be increased by a factor of .
The new cross-sectional area is:
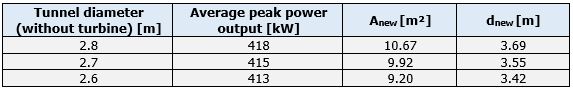
The new diameter would not ensure cavitation free operation, because the minimum water level at the dam is 3m. Therefore the diameter needs to be decreased. The number of turbine units will increase respectively.
TURBINE UNITS
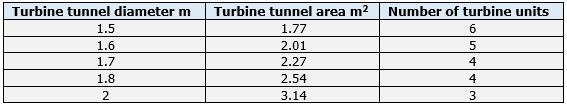
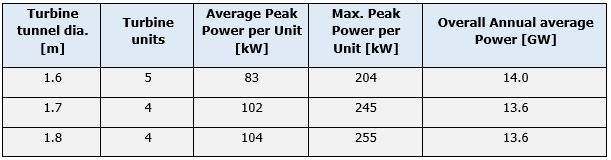
To proceed with the assessment we have decided to use a diameter of 2.7m. It is a good compromise between a small cross-sectional area, which reduces the number of turbine units, and maximum power output. To cover the area of 9.92m², and depending on the turbine tunnel diameter, the following number of turbine units were estimated to fill the criteria.
The relation between turbine tunnel to turbine runner is roughly 2:1 which means that the turbine runner is two-times smaller than the turbine tunnel diameter. In the next step examples from the industry have been investigated to make a decision about a suitable turbine size. In our project the head above the turbine is 1m at neap and 2.5m at spring tides. The following table summarizes some small hydro turbine examples.
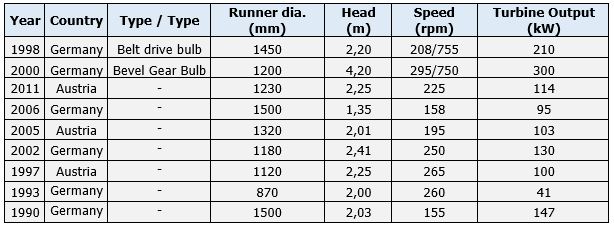
Due to two main reasons a turbine tunnel diameter of from 1.6 to 1.8m is recommendable. This would reduce the risk of cavitation and a gear box to drive the generator is not needed. The turbine runner for a turbine tunnel of 1.8m (1.6m) diameter will be about 0.9m (0.8m). According to the industrial examples the rated speed will reach a value between 240rpm to 260rpm with a head of 1.9m with the chosen runner diameters. A gearbox is not needed for a speed of 250rpm. Using a turbine runner with a diameter of 1.7m instead of 1.8m would increase the runner speed (no gearbox), and would only have a small effect on the maximum power output (see: power calculations) but higher investment costs in terms of turbine units.
POWER CALCULATIONS
The power output for each proposal is calculated based on the new diameter of the turbine tunnel. Especially the peak power output is important to see, if the grid is able to cope with the generation and if the demand matches the generation. The average peak power uses the mean tidal range and the maximum peak power uses the maximum tidal range.Note: Calculations include efficiency ratios.
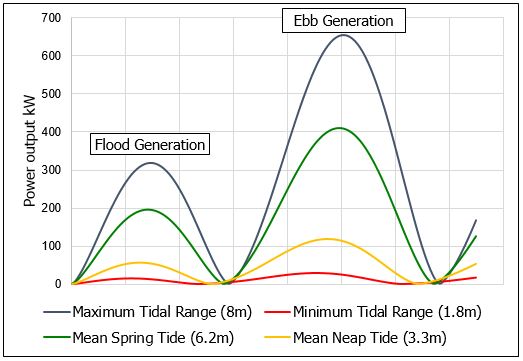
Additionally, it has been found that ebb generation has a higher power output than flood generation, since the water head over the turbine is higher (peak power is reduced). Ebb generation is generation when the water level inside the basin is higher than on the open sea site. During flood generation the head over the turbines reduces faster than during ebb generation, which shortens the period of power production. This is caused by the fact that the volume of water outside the basin is far greater than inside the basin. Our system will use both generation types to produce power over a long period of time.
Note: 4 Turbines of 1.7m tunnel diameter are used and efficiency ratios are included.
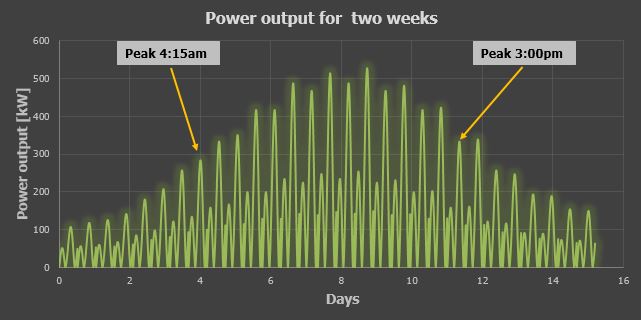
The last step in our assessment included a power spectrum calculation over two weeks. We used again four turbines with a diameter of 1.7m. Over a whole year the tidal range varies each day due to the alignment of Earth, Sun and Moon and therefore the overall generated power is not constant. In this calculation we adapted for each tidal cycle the tidal range which we estimated from the original tidal data of the Isle of Whithorn. The power peak varies significantly over two weeks during the tidal cycle of 12.5h. Tidal power is a predictable source, but not a felxible one. It is not possible to regulate the generation according to the demand without an efficient storage system. Therefore it is difficult to exactly match the peak demand of the village, which normally occurs at night due to the electric heating systems or in the evening.