For the proposed tidal barrage we assessed the site of the harbour, using:
- Topography of the site obtained from maps
- Tidal data of the area
- Bathymetry data of the harbour
TOPOGRAPHY
Estimation of the Basin Area
A tidal barrage is a dam in an estuary, river or bay with submersed turbines which are turned due to the water head caused by tides generating electrical power. The enclosed area is called basin area. The estimation of the basin area is very important, since it has a huge influence on the power production of the Tidal Barrage. Therefore we focused our assessment to balance the largest possible basin area for maximum power production and the shortest length of the dam to reduce construction cost.
Definitions and Assumptions
Before the basin area is estimated some important definitions are mentioned to understand the assessment.
Chart Datum is a plane to which all tidal heights are referred to.
Tidal range is the vertical difference between the high tide and the succeeding low tide.
The tides are dependent on the position of the earth towards the moon and the sun and the resulting forces. There are normally two special tide scenarios worth to mention: Spring and Neap tides. Spring tides happen at full and new moon quasi two times per lunar cycle. During spring tides the earth, moon and sun are aligned and therefore the forces are stronger and the tidal range is higher. Neap tides happen at first and third quarter moon, when the sun and the moon aligned perpendicular to each other. The resulting force is weaker and the tidal range is smaller. The basin area changes during each tide cycle between high and low water. Therefore it is important to evaluate the highest and lowest possible water level in the basin. This is possible by assessing the MHWS and MLWS water levels. MHWS (Mean high water spring) is the average height of the high waters of spring tides above Chart Datum. MLWS (Mean low water spring) is the average height of all low waters of spring tides above Chart Datum.
During our analysis we assumed that the Basin Area changes between MHWS and MLWS linearly and that the maps are based on the above definition for MHWS and MLWS.
The Basin Area
The estimated Basin Area for our tidal barrage varies between 0.15km² at MHWS and 0.052km² at MLWS. The dam for the barrage will be 310m long. The figure below shows the impounded basin area at MHWS and the location of the proposed barrage.
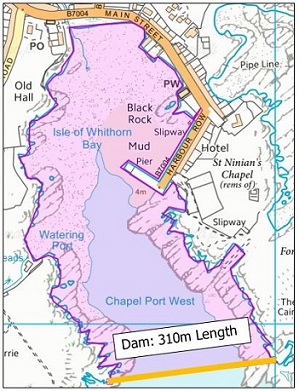
Source: digimap.edina.ac.uk
TIDAL DATA
Tidal data for six months have been evaluated and it is assumed that the behaviour for the whole year is similar. This is shown in the picture below.
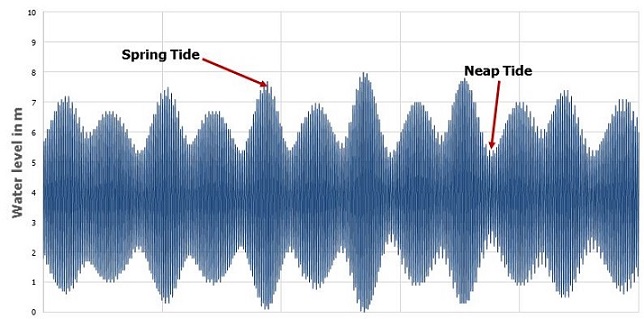
The following tidal ranges are acquired for the analysis:
- Mean tidal range: 5m
- Mean Spring Tidal Range: 6.2m
- Mean Neap Tidal Range: 3.3m
BATHYMETRY
The bathymetry is used to acquire the basin area depth to find for instance the position of the ship gate and the turbine tunnel. The depth shown in such maps is relative to the mean sea level. The map below is the bathymetry data for the Isle of Whithorn Bay. The barrage position is highlighted and the water depth there varies between 5m to 8m.
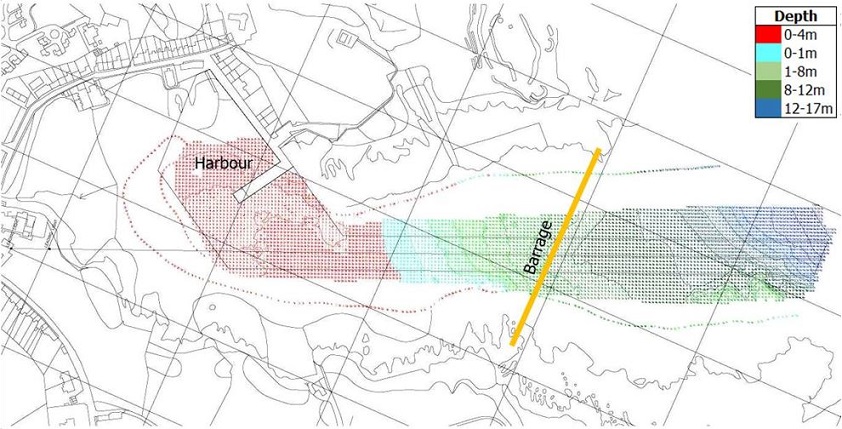
Source: Isle of Whithorn Harbour, surveyed by Clydeside Surveys Ltd, February 2013