Results
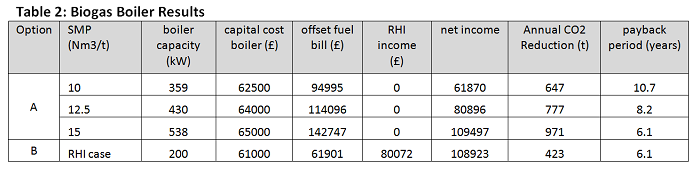
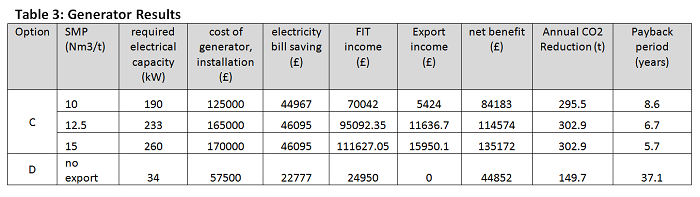
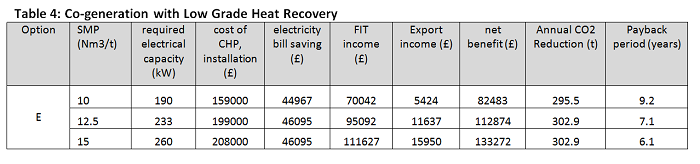
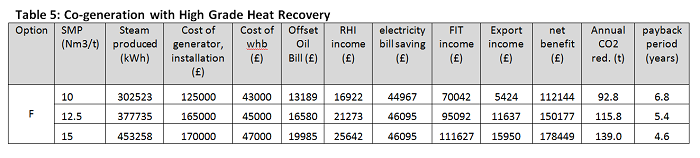
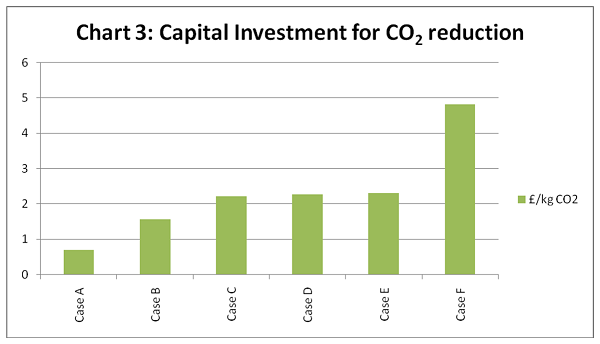
Chart 3 below shows the effect on emissions of the various investment options at the 15Nm3/tonne SMP rate:
Payback period for each option under different fuel production scenarios is illustrated in Chart 4; note Option D offers a payback period greater than 15 years and is not shown to full scale for clarity:
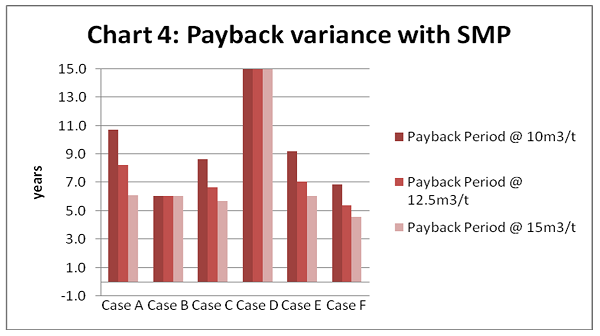
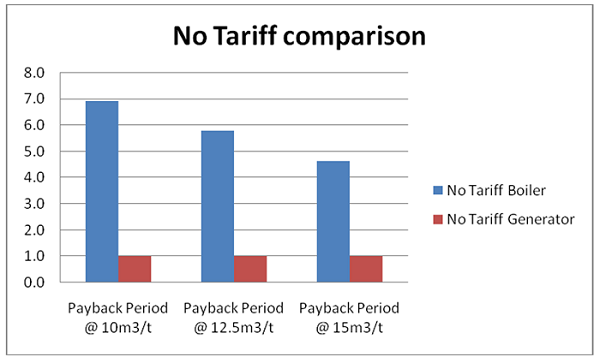
Chart 5 shows the relative payback periods of steam and electricity generation if no FIT or FHI tariffs were available.