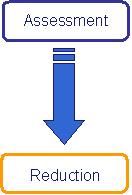
DEMAND AND CARBON
EMISSIONS ASSESSMENT
The starting point to the whole carbon
neutral community pathway is the assessment of the demand
and carbon emissions of the community.
Assessment of the community is essential
to determine the current demand and hence emissions by the
community as well as the efficiencies of the buildings.Based
on the assessment, the suitable building fabric improvements
and appliances upgrade can be identified to be implemented
in the reduction of the demand and carbon emissions.
In order to carry out assessment on the
demand and carbon emissions of the community, we must first
collect relevant data and analyse them.
The ideal way of determining the current
demand and carbon emissions is through the energy bills.
However, this is usually difficult to obtain especially
when gathering data from the residential sector. In the
absence of the energy bills, estimates have to be made using
estimation or suitable modelling tool. The required data
for this are basically demographics and building stock of
the community. They are important as demand and carbon emissions
can be estimated from them.
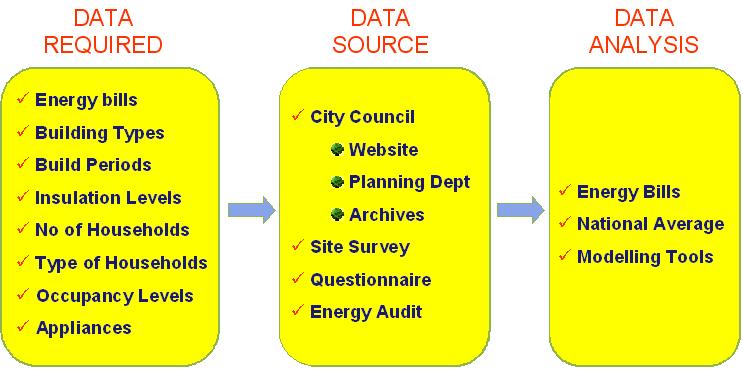
DATA REQUIRED
A) Energy Bills
Energy bills that we are interested in
is the gas, electricity and oil (for heating) bills. This
could be an annual, quarterly or monthly bill. However,
the objective is to find out the annual energy consumption
per household and finally the community
The type of demographics data that we
are looking for are;
o No and type of households in
the community
o Occupancy levels
C) Building Stock
The building stock is actually more related to estimating
the current level of building efficiency which includes
the appliances in the households. The data that we are
interested in are;
o Building types (flat, terrace,
semi-detached etc.)
o Building periods (Victorian, 1920s-1950s council
houses, new build etc.)
o Window glazing
o Insulation Levels (Loft, floor, wall, draught-proofing
etc)
o Type and number of electrical appliances and their
energy efficiency ratings

DATA SOURCE
There are many ways to obtain the data. Generally, they
are available from the city council or through carrying
out your own site survey, questionnaire or energy audit.
i) City or Community Council
It is advisable to try finding the data from the city
or community councils first as the other sources of getting
hold of the data is energy and time consuming. Also, make
it a point to make an appointment and check the opening
hours before going to the councils and archives. The Stirling
archive for example, is open to the public from Mondays
to Wednesdays only. Please note however, that you might
be charge for the data if the requested data is not meant
for academic purposes.
Usually, there are published census data
on the website which gives information on the demographics
of the community. Stirling census 2001 can be reached through
this link. However, a request or visit to the planning department
and/or archives is most likely necessary in order to establish
your building stock especially if you are planning to conduct
a site survey, questionnaire or energy audit.
You can get the latest site map of your
community from the planning department. This is extremely
useful in strategising your site survey. Meanwhile, the
older area plans and building plans can be found in the
archives.
ii) Site survey
Site survey is basically collecting data through walking
around the neighbourhood and records your observations.
Suitable data to collect using this method is building
types such as tenement, semi-detached, detached and terrace.
Site survey can also be used to determine the build period
of the buildings in your community (Victorian, 1920s council
houses, new build etc). You could also find out some information
regarding the insulation level of the buildings such as
the window glazing type. Also, this method is simple;
it is very time and energy consuming. For a more accurate
data, you will have to knock on some doors, one per every
street to get the representative data of the street.
Build Period
If you are surveying for residential buildings,
here are some general tips in recognising the different
build periods
Build
Period |
Typical
Characteristics |
Victorian
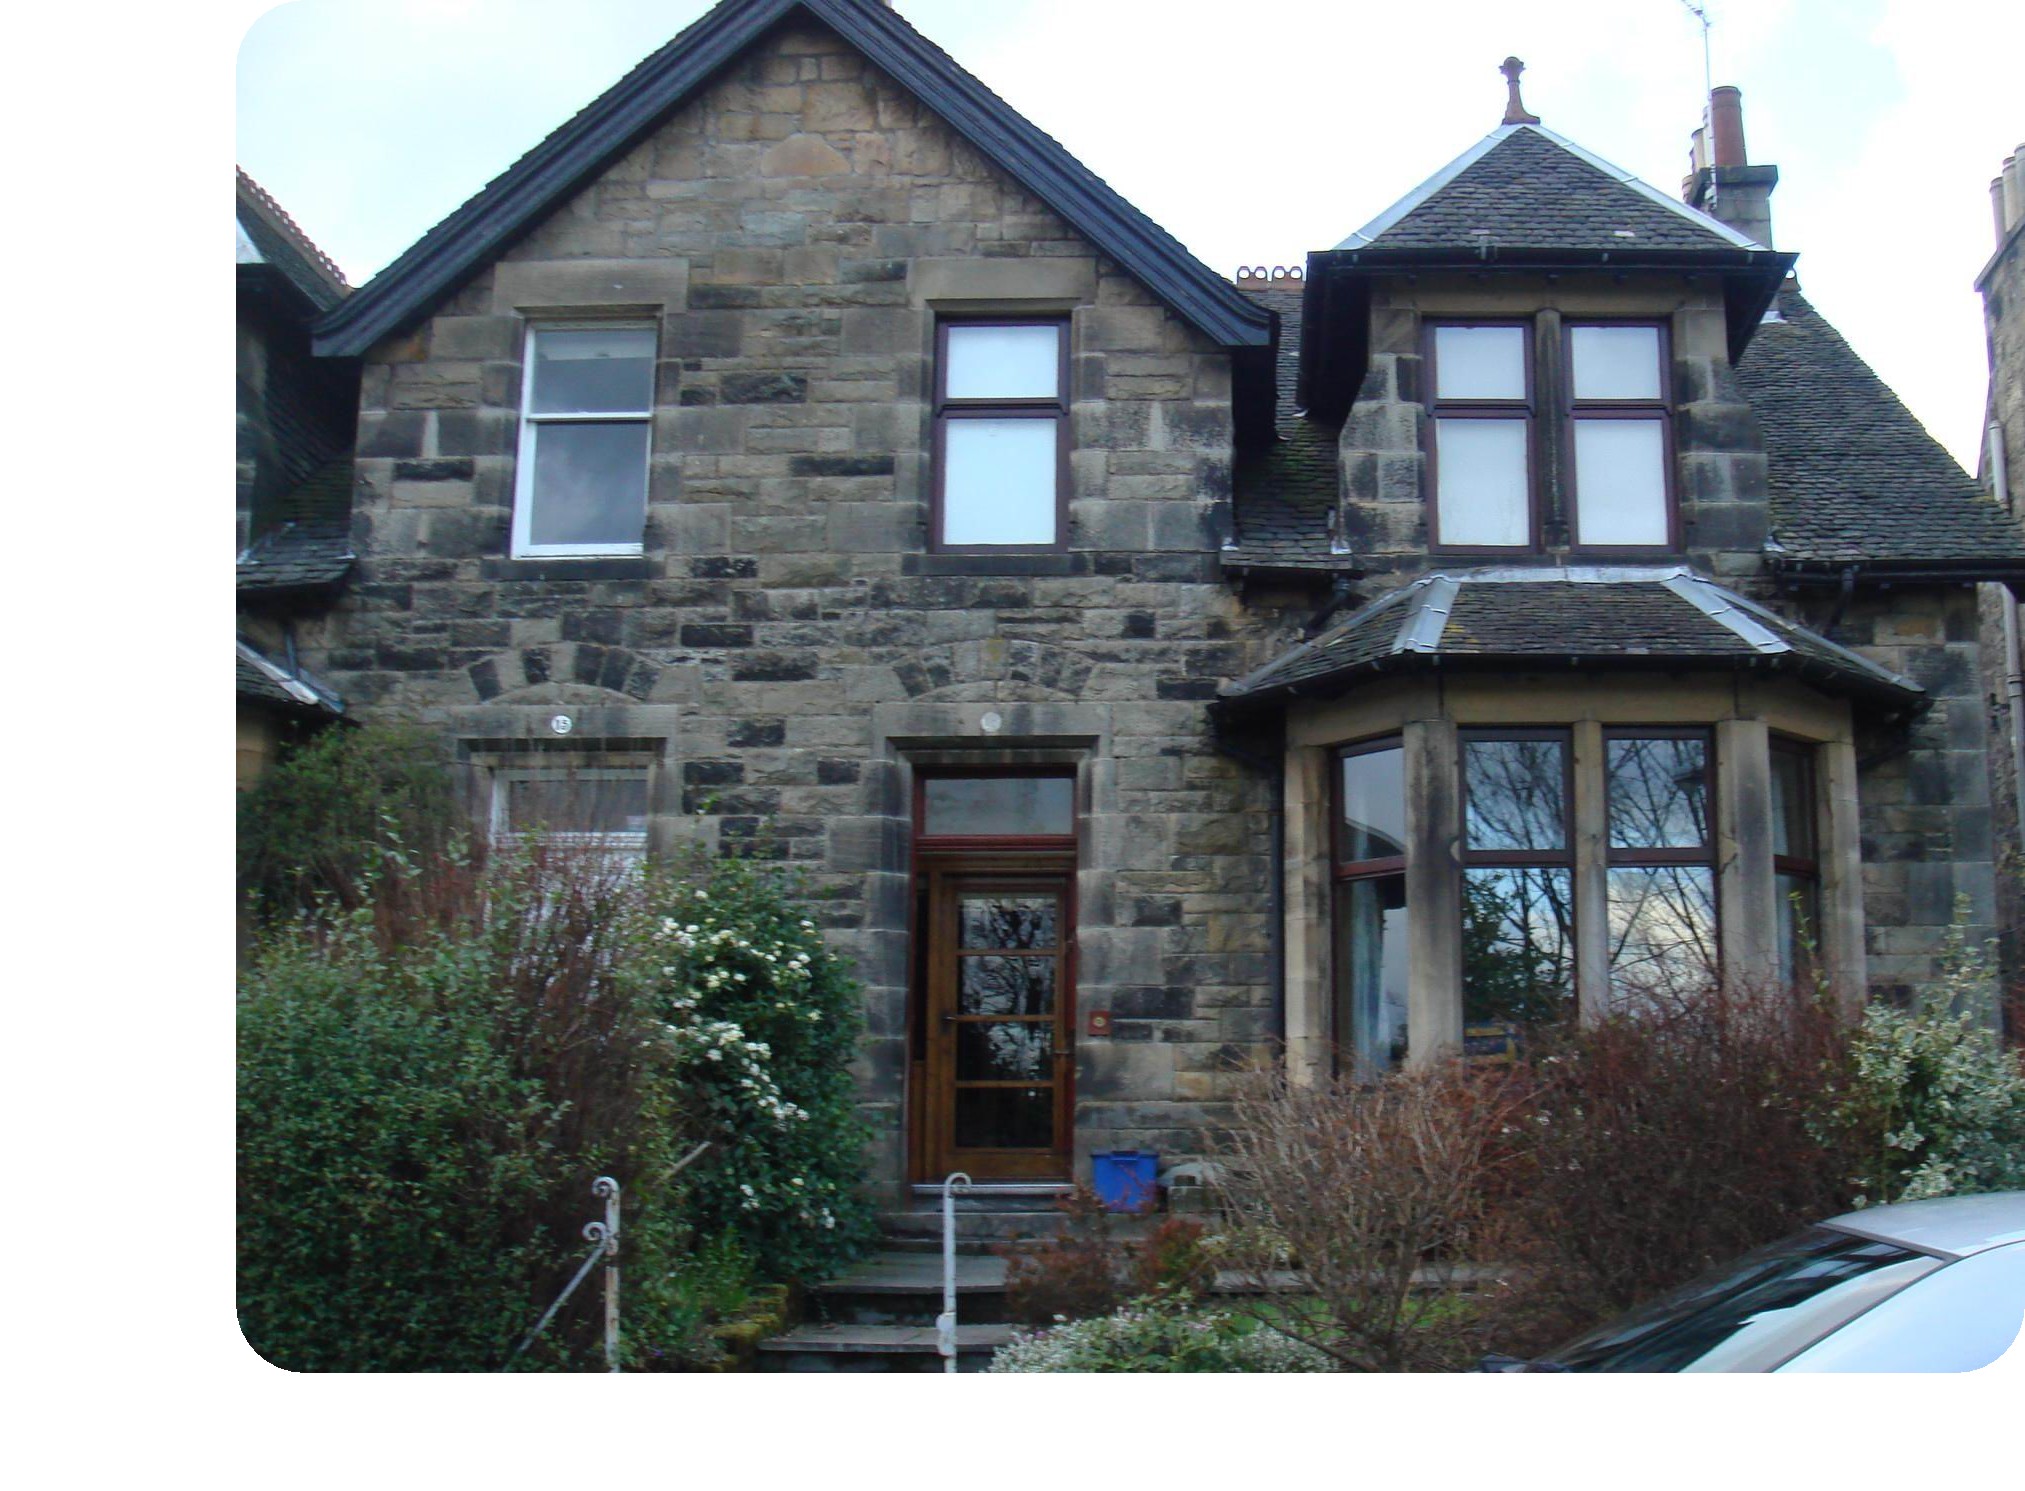
|
-
Large solid stones
-
Natural slate roofing
|
1920s-1950s
council houses
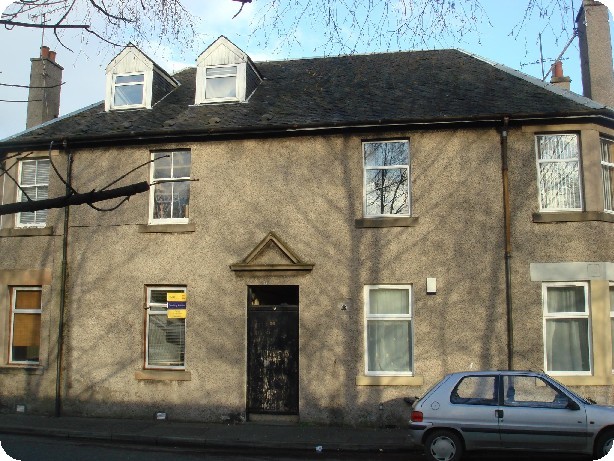
|
- Harled exterior
- Generally ‘two up two down’
|
New build
(post 1980)
|
- Brick leaf
- Timber framed construction
|
The questionnaire must be design and tailor-made to your
method of analysing the data especially when software
is involved. It is advisable that the questionnaire be
structured as simple, short and as concise as possible
to ensure the person who fills it in does not lose interest
or be discouraged. Bear in mind that you must have a representative
sample or statistically significant sample size for your
questionnaire. Typically, the sample size used is ten
percent of the population size.
There are many ways to distribute the
questionnaire so as to optimise the response. Some of them
are listed below;
1. Through the mail - should include
return stamp and envelope with return address written
on it.
2. Through emails
3. Face to face interview
4. Email the questionnaire prior to face to face interview
A sample of the improvised questionnaire used in our
case study can be found here.
Energy audit is a very detail version
of a questionnaire. It is the most accurate way of obtaining
the energy consumption pattern of the community. It would
be most beneficial if you are trying to estimate the demand
profile of the community as well as suggesting upgrades
of appliances. Energy Audit is usually carried out for the
industrial sector.
The collected data must then be processed
and analysed to establish the building stock in particular
efficiency of the building. The current demand and carbon
emissions are then calculated. Many methods can be adopted
to analyse the data and most of them can be done by using
spreadsheet especially if you have the energy bills.
Calculating Current Demand and Carbon Emissions
i) Using Energy Bills
Simply sum up all the electricity and gas bills of all
the households within the community.
Total electricity used by the community
in a year = a kWh
Total gas used by the community in a year = b
kWh
Meanwhile, to find out the amount of carbon emissions
by your community multiply the annual total amount of
gas used by 0.19* and annual total of electricity by 0.43*.
Total carbon emissions from gas =
a x 0.19 = c
kg CO2
Total carbon emissions from electricity = b
x 0.43 = d kg CO2
However, some households still use oil-burning boiler
for space and water heating. If this is the case, carbon
emissions from the oil can be calculated by multiplying
the amount of oil used in a year in litres with 2.975*.
Total oil used by the community in
a year = e litres
Total carbon emissions from oil = e
x 2.975 = f kg CO2
Therefore, total domestic annual energy
demand in the community = a + b +
e kWh
And, total domestic annual CO2 emission in the community
= c + d + f kg CO2
Alternatively, there are many online
carbon calculators. Some of them are listed below:
*Source:
ii) Using National Annual
Average Energy Consumption
In the absence of energy bills, a rough
estimation of current demand and carbon emissions can
be made using the national annual average energy consumption.
For this approach, you will need the number of households
or number of residents in the community.
2003 Annual
Demand Data
(Source: Department of Trade and Industry) |
Consumption
(kWh) |
| Total domestic energy consumption per household |
27,630 |
| Total domestic energy consumption per capita |
11,410 |
Total energy used by the community in
a year
= number of
households x 27,630 kWh or
= number of residents x
11,410 kWh
This time, the carbon emissions can be
found by multiplying the annual total amount of energy used
by the community by 0.189
iii) Using modelling tools.
In the absence of energy bills and you
would like to have a more accurate estimation of the current
demand and carbon emissions, modelling tools should be used.
The team used an in-house developed tool called Strathclyde
Domestic Energy Modelling (SDEM). Unfortunately, it is not
publicly available. However, the team has developed a tool
which can generate daily electricity and heating (gas) demand
profiles of the community. From this demand profiles, annual
energy consumption can be derived and converted to carbon
emissions.
There are also other online tools that
can help you with this. All you have to do is choose a representative
household for each household type and then multiplying it
with the relevant number of households. One of them can
be found through the link below:
To view sample of data analysis done
on the case study: the Riverside community, please click
here. |
|