CASE
STUDY
Riverside
Community, Stirling
The methodology of becoming a carbon neutral
community that the group had developed was tested to Riverside
Community, Stirling. This opportunity was offered by Wise
Group and Riverside community itself who is very determined
in becoming a carbon neutral community.
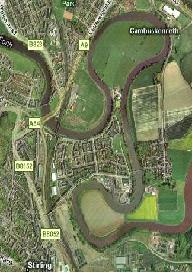
Riverside Community is located in the heart
of Stirling down town at latitude 51°10' N and longitude
3°45' W. The area is dominated by domestic sector with
small percentage of commercials. Due to the time limitation,
the implementation of the case study was focused on domestic
sector highlighting on the first two steps of the methodology
This case study was conducted based on
several pre-determined objectives which are as follows:
• To assess the effectiveness of the methodology
and provide a good platform for feedback and improvements.
• To assess the current energy demand and carbon
emission in Riverside Community
• To assess the possible demand and carbon reduction
that can be achieved in Riverside Community
• To recommend the offset options for the remaining
demand and carbon emission

The carbon neutral community pathway/methodology was used
in the case study. The pathway consists of three steps as
below;
The team decided to use S.D.E.M. modelling
tool to assess current energy demand and CO2 emission in
Riverside Community. Hence, a series of data were required
for the modelling process. For Riverside, the data are as
follows:
-
Household Stock
-
Building Stock
For more details regarding the S.D.E.M.
software, visit the tools
section of this website.
1. Household
Stock
Census carried out on Riverside in 2001
shows that there were 760 households at the Riverside area.
However the site survey taken by the project team in 2007
found that the number of households was 1015. Thus, in order
to project the number of different households in the year
2007, the household percentage share indicated in the Census
2001 is retained and applied to the 1015 households. The
results are shown on the table below:
Total number of houses in Riverside for 2007 (from site
survey) = 1015
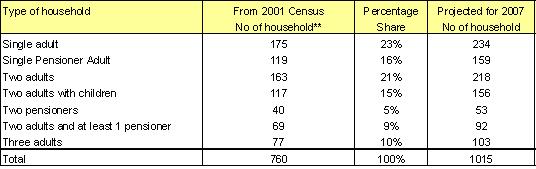
Table 1: Household stock for Riverside
Community
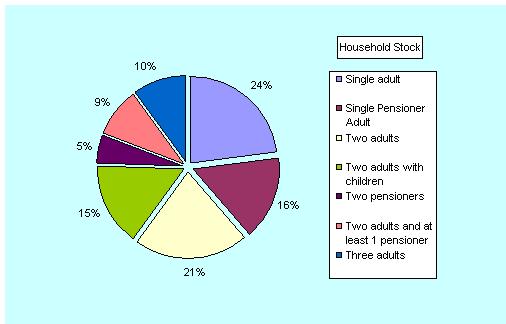
Figure 1: Household stock by type of occupancy
2. Building
Stock
In Riverside, it is found that the building
period of the building stock can be broken down as follows:
o Victorian
o 1920s to 1950s
o 1950s to 1970s
o 1970s to 1998
o Post 1998
As for building type, the brake down is
as follows:
o Tenement
o Terrace
o Semi-D
o Detached
The clustering of the building stock is
for the purposes of computer modelling. The building stock
distribution and statistic for Riverside Community is as
shown in figures below.
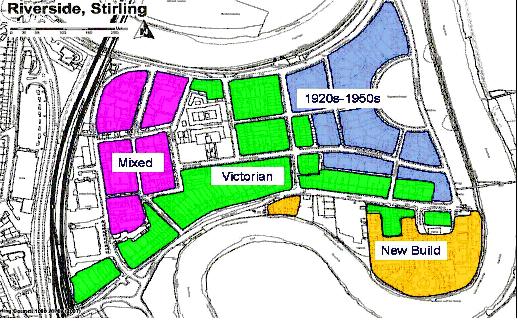
Figure 3 : Building stock
distribution in Riverside Community
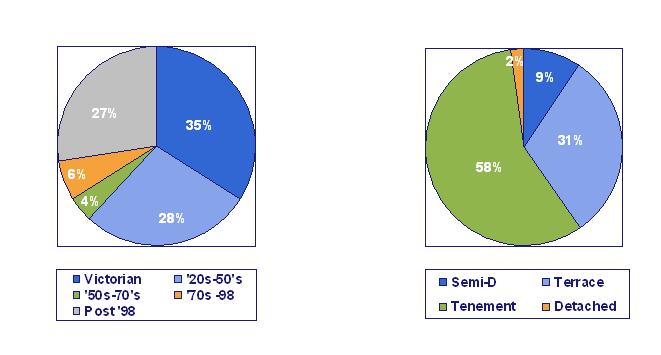
Figure 4 : Building
stock by build period |
Figure 5 : Build
stock by building type |
3. Insulation
Level
The insulation level of the building stocks
is important in determining the current energy demand and
CO2 emission of a community. The insulation level is examined
by looking at the percentage of houses with double glazing,
loft insulation (if necessary), wall insulation, draught-proofing
and wall insulation.
For Riverside community, the current insulation level is
as follows:
Window Glazing
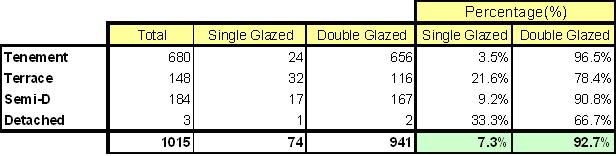
Table 2: Window glazing
percentage in Riverside
Other Insulations
Insulation
|
Percentage
in the community (%) |
Loft insulation (100mm)
|
90% |
Pipe lagging
|
5% |
Draught proofing
|
5% |
Floor Insulation
|
5% |
Cavity wall insulation (1920’s to 1950’s)
|
90% |
Solid wall insulation (Victorian)
|
5% |
Table 3: Other insulation
level in Riverside Community
From the data and statistic above, general
assumptions were derived to be used in SDEM simulation.
This is to estimate the current energy demand and CO2 emissions
of the Riverside Community. The assumptions are:
Parameter |
Level |
Low energy lighting
|
Half |
Boiler type
|
Standard combi boiler |
Window glazing
|
Double glazing |
Draught proofing
|
None |
Ground Insulation
|
None |
Loft Insulation
|
100mm |
Cavity or Wall Insulation
|
Cavity (except Victorian) |
Table 4: Step 1 SDEM assumptions
Based on the above assumptions, simulations
were carried out on 32 S.D.E.M. models (to represent the
building stock in Riverside). Output of various models are
summed together to find the aggregated values for the whole
community.
From the simulations, the estimated
current energy demand and CO2 emissions for Riverside Community
are:
Energy Demand
CO2 Emissions
The energy demand and CO2 emissions can
be reduced by implementing some reduction measures. For
a community, the main reduction measure is by upgrading
the building fabric of the building stock as mentioned in
demand and CO2 reduction section.
Hence, to estimate the amount of energy
and CO2 emissions reduced by that measure, the team once
again decided to use SDEM modelling tool but with different
set of assumptions. The new set of assumption is as follows:
Parameter |
Level |
Low energy lighting
|
100%
|
Boiler type
|
Condensing combi boiler
|
Window glazing
|
Double glazing
|
Draught proofing
|
Windows, doors, loft access, ground
floor, porch on external door
|
Ground Insulation
|
Yes
|
Loft Insulation
|
250mm
|
Cavity or Wall Insulation
|
Cavity and/or wall insulation
|
Table 5: Step 2 SDEM assumptions
From the simulations, the estimated
remaining energy demand and CO2 emissions for Riverside
Community are:
Energy Demand
CO2 Emissions
The comparisons on the energy demand, CO2 emissions and
energy cost before and after the building fabric upgrades
are shown in the graphs below:
• Annual Energy Demand Comparison (kWh
pa)
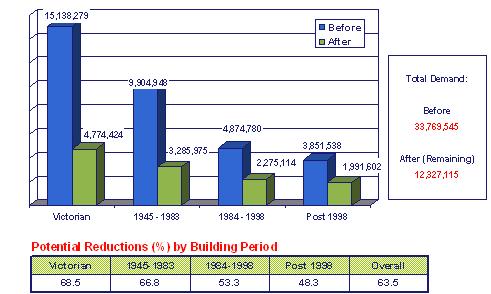
Figure 6: Annual energy
demand comparison
• Annual CO2 emissions Comparison
(kgCO2 pa)
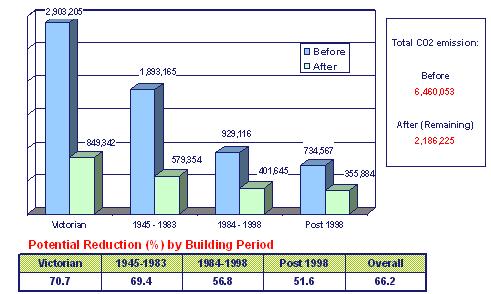
Figure 7: Annual CO2
emissions comparison
• Annual Energy Cost Comparison
(£ pa)
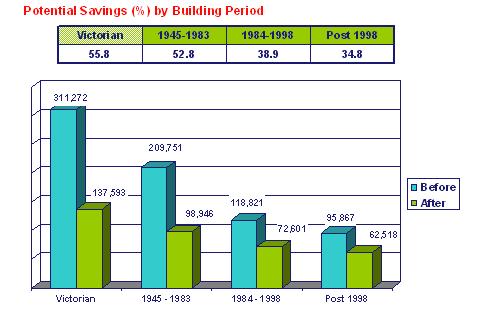
Figure 8: Annual Energy
cost comparison
The last step to become a carbon neutral
community is to offset the remaining energy demand and CO2
emissions. This step begins with the analysis of remaining
energy demand profiles. Demand profiles allow the peak and
trough of the demand to be identified which makes the sizing
of the offset to become easier.
In this case study, the team generated
the demand profiles using ‘Electricity Demand Profile
Generator’ and ‘Heating Demand Profile Generator’.
The outcomes of the generators are shown in the figures
below.
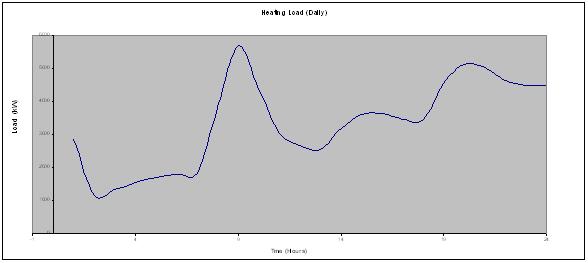
Figure 8: Daily heating demand profile for
Riverside Community (winter season)
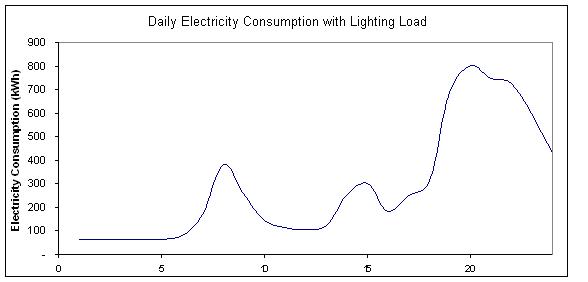
Figure 9: Daily electricity demand profile
for Riverside Community
To offset the above remaining demands,
the team decided to just focus on three micro generation
technologies which are ground source heat pump, solar PV
and wind turbine. For heating demand in the community, demand
supply analysis was carried out involving ground source
heat pump. It was done using simple spread sheet analysis
and the result is as follows:
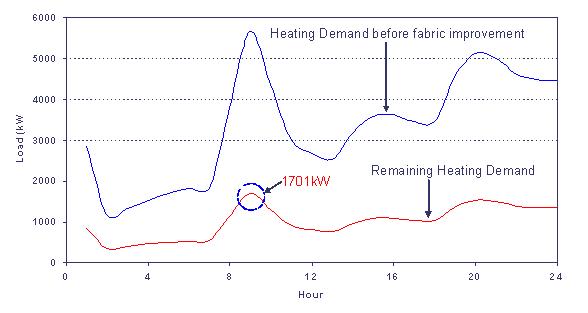
Figure 10: Heating profile
for demand supply analysis
Analysis |
Findings |
Maximum daily demand during winter
|
23,979 kWh/day |
Peak demand during winter
|
1071 kW |
Ground source heat pump capacity
|
8 kW |
Number of ground source heat pump
needed
|
213 unit |
Total ground source heat pump capacity
|
1704 kW |
Maximum energy generated by GSHPs
|
40,896 kWh/day |
Table 6: Demand supply analysis
for heating
For electricity demand, the team used software
called Homer for demand supply analysis. With the average
solar radiation of 2.44 kWh/m2 per day and average wind
speed of 4.6 m/s in the community, the result of the supply
demand analysis is as follow.
| |
Case 1 |
Case 2 |
Total Solar PV capacity
|
500 kW |
500 kW |
Solar PV per household
|
0.49 kW |
0.49 kW |
PV area needed per household
|
3.94 m2 |
3.94 m2 |
Total no of wind turbine (2kW per unit)
|
1000 unit |
2000 unit |
No of wind turbine per household
|
1 unit |
2 unit |
Total number of batteries (1900Ah per unit)
|
1000 unit |
3000 unit |
Number of batteries per household
|
1 unit |
3 unit |
Unmet electricity load
|
20% |
0% |
Estimated cost per household
|
£ 4.9 million |
£ 8.9 million |
Estimated cost per household
|
£ 4820 |
£ 8770 |
Table 7: Summary of supply demand analysis
for electricity
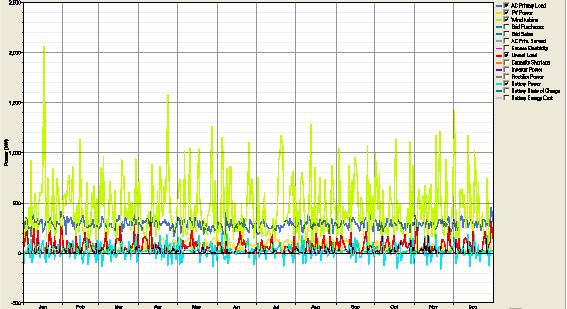
Figure 11: Demand supply analysis graph
for Case 1
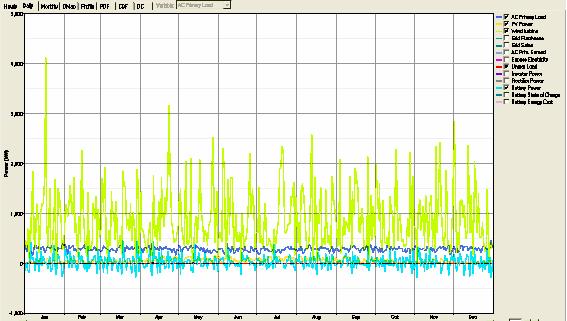
Figure 12: Demand supply analysis graph
for Case 2
In Case 1, there is approximately 20% of
unmet electricity load. This unmet electricity load can
be catered by life style changes as explained in reduction
section or by investing some more money for extra renewable
capacity as shown in Case 2. In Case 2, the optimized solution
to meet all the demand is by adding the capacity of wind
turbine and batteries (as shown in Table 7). There’s
no capacity addition required for solar PV due to its high
cost.
Based on the Riverside case study, the
team had come to a few conclusions as follows:
o The suggested methodology was proven effective as a
guideline in order to be a carbon neutral community. However,
there are challenges and barriers in implementing the
methodology as highlighted in conclusion
section.
o The estimated current total energy demand for Riverside
community is approximately 33,769,545
kWh p.a while the current CO2 emission is estimated
to be approximately 6,460,053 kgCO2
p.a.
o By implementing the suggested building fabric upgrades
in the community, the overall energy demand and CO2 emissions
have the potential to be reduced by 65% to 70%.
o Based on our brief studies, the remaining heating demand
in Riverside community can be catered by introducing 213
units of 8kW ground source heat pump. However, this is
subject to the space availability, suitable ground material
and other geographical factors.
o As for the remaining electricity demand, based on Case
1, the demand can be met by having 500kW of solar PV,
1000 units of 2kW
wind turbine and 1000 units of 1900Ah
batteries. However, there’s 20% unmet electricity
load under this option.
o This 20% unmet electricity load can be catered either
by implementing energy efficient lifestyle, which will
save money, or investing some money to increase the number
of wind turbine and batteries to 2000 units and 3000 unit
respectively as suggested by Case 2.
|