Case study >>>

A university not too far from Strathclyde...
The following case study refers to a generic university in Glasgow. Although some data is originated from Strathclyde University, assumptions were necessary during the work that diverge from the university case, therefore leading to a possible non-specific application of results. The organization of the case study closely follows the framework developed, since its main purpose is to test the proposed framework.
Estate details >
The case study estate is 60,000sq.m - 50/50 split of residential and office/academic zones. The half-hourly energy demand profiles of which are derived from a MERIT database relating to a previous study of residences and offices in Dalmarnock, Glasgow.
Scaling of the dalmarnock office profiles was undertaken by matching energy consumption with that of a typical office (Energy Efficiency Office, Energy Consumption Guide 19) and comparing with the Graham Hills building at Strathclyde (academic/administrative in nature) to dtermine applicability for the campus. During this process, profile peaks were checked to ensure they were represenative of installed electrical & thermal capacities of an office (CIBSE, Guide F) and that plant on/off times were typical. The results can be viewed below:

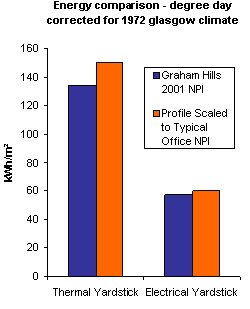
A slight divergence we made from the typical office data was to increase the overnight electrical load from 1/5 to 1/3 of peak daytime load as a result of another study of the academic island site at Strathclyde. A similar process was carried out for the residential profile using energy consumption data from Strathclyde's James Goold Hall.
The profiles were then blended and scaled to the 60,000 sq.m estate. The results are shown below for three typical day types and transitional weekend.
Estate Electrical profile > Estate thermal Profile >
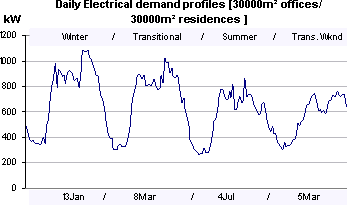
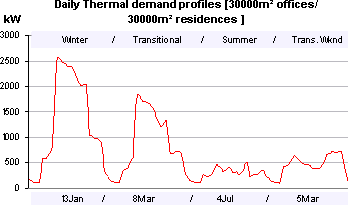
The typical day types are derived from a frequency plot of direct normal solar radition, wind speed and ambient temperature from the reference 1972 glasgow climate file.
Energy Efficiency >
To obtain quantifiable results for energy efficiency measure the form, fabric, building services plant and operation were based on the Graham Hills Building (Office type) and the James Goold Building (residential accommodation), both university of Strathclyde properties. Limited building data was gathered through the estates management department and was supplemented with a visual survey of the properties. Additional data was assumed for the purposes of this exercise based on typical designs for the time period of construction. All data used in the case study can be viewed in the ‘Building Survey' worksheet.
(The analysis for the office building was the most involved due to the higher level of service. Therefore the procedure for the office is documented in the case study only although a similar procedure was undertaken for the residential properties.)
The first analysis step involved modelling the buildings annual energy consumption. DemCalc (see downloads) was developed for this purpose and has evolved to its present form through application. Each building service was classified as thermal energy, cooling energy (converted to electrical at a COP of 2.5) or electrical energy and modelled in such a manner as to allow potential energy reduction measures to be applied and measured relatively. ESP-r, a dynamic simulation programme, was also used in conjunction with the tool to allow time variant parameters to be measured. The building survey data was entered into the tool and the base case energy consumption was calculated, illustrated below for the office case.
|
Thermal energy |
Electrical Energy |
Base Case( kWhrs/yr) |
6,024,604 |
1535593.00 |
It was assumed that the housekeeping measures or no cost measures were undertaken as listed in the framework. The potential energy reduction measures were then selected objectively from the ‘Energy Reduction Options' work sheet. This was based on the current standard of service within the building for example it was obvious from viewing that the domestic water insulation needed to be replaced, lighting was not as industry standard, single glazed windows were causing drafts and increased heat loss etc. Other measures were eliminated as they were not applicable, such as the boiler upgrade due to the proposed district heating system. The resulting list of measures appropriate to the office case study were as follows:
Low Cost Options
- Improve air tightness by draught stripping to reduce infiltration rates.
- Add/upgrade thermal insulation to domestic hot water distribution.
- Install high efficiency luminaries.
- Automatic lighting control using time switches or occupancy sensors.
- Automatic HVAC plant set backs using time switches or occupancy sensors (Install inverter drives on fans and pumps).
Capital Cost Options
- Upgrade glazing to double, triple or solar control.
- Replace existing pump and fan motors with high efficiency types.
- Install free cooling chiller to utilise ambient temperature when sufficiently low.
- Install heat recovery devices.
- Install building energy management system to monitor and control plant.
- Install day lighting sensing controls to increase natural lighting usage.
- Absorption Cooling.
Each measure was then assessd and the results were as follows:
| Measure | Description of Analysis | Thermal Energy Saving (kWhrs/Yr) | Electrical Energy Saving (kWhrs/Yr) | Payback (Years) |
| Draught Stripping | Reduced perimeter infiltration rates by 0.5ac/hr. | 596,268 | 0 | 0.44 |
| DHW Insulation | Increased insulation on HWS/R to reduce W/m heat loss to 5%. | 65569.20 | 0 | 6.20 |
| High Effi. Luminaries & Control | Decreased lighting to 8W/m 2 , T5 luminaries. From ESP-r model, 37% of perimeter lighting switched off using control. | negligible increase | 297,761.93 | 10.07 |
| Variable Speed Drives | Used rule of thumb, 25% electrical saving. | 0 | 90,789.25 | 9.15 |
| Double Glazing | Increased glazing U-value to 2.2 W/m 2 K double glazed. | 158,056.24 | 0 | 25.66 |
| High Effi. Motors | Increased motor efficiency from installed 75% to 90%. | 0 | 21809.50 | 3.79 |
| Free Cooling Chiller | Utilise ambient when below 5 o C. Available for 460hrs at peak load. COP2.5. | 0 | 632540.8 | 39.43 |
| Thermal Wheel | Heat recovery efficiency of 50%. Calculated against yearly temperature profile. | 716477.20 | 0 | 5.02 |
| BEMS | Used to monitor and/or control plant. | (as control measures) | (as control measures) | > 10 years |
| Absorption Cooling | Waste heat assumed free, available for 840hrs. Peak load 343.7kWhrs. COP 0.68. | 0 | 74111.3 | 37.8 |

NB. The ESP-r model referred to above was a total of 36m² representing a section through the office (see below) .
The north an south facing office each had 20% glazing on the external facades. The perimeter offices were 6m deep and assumed to be natural ventilated. The internal offices were mechanically ventilated with an equipment load of 30W/m² , lighting load of 12W/m² and an occupancy load of 2 persons per office at 100W sensible.
The options were considered to be viable if the payback was less than 10years. The measures that met the criteria were put forward into the ‘Option Selector' for global selection. The reduced energy consumption was calculated as follows assuming all measures were accepted.
|
Thermal energy |
Electrical energy |
Base Case (kWhrs/yr) |
6,024,604 |
1,534,309 |
Final Case (kWhrs/yr) |
4,646,290 |
1,123,948 |
Percentage Reduction (%) |
22 |
28 |
Final yardstick (kWhrs/yr/m²) |
155 |
38 |
Typical yardstick (kWhrs/yr/m²) |
150 |
50 |
The final measures were then analysed on the representative seasonal days(13 th January, 8 th March and 4 th July) on an hourly basis to allow manipulation of the demand profiles. This was necessary to make the profiles representative of the revised building demand taking into account the energy reduction measures in place.
The modified profiles for the final measures can be found in the ‘Energy Calculator'. The office thermal profile altered for heat recovery is shown as an example below. The proportion of the peak load that represented the air tempering was assumed as 30% and the thermal wheel efficiency was taken as 50% .

Demand matching >
From the available technologies, briefly described in the “supply” chapter of the framework, the most valid for application on the campus estate were CHP (including domestic hot water), solar thermal, PV and wind power.
Using Merit with the typical days, 13th of January for Winter, 8th of March for Transitional, 4th of July for Summer and 5th of March (weekend load profile), results were processed and inputted into our GenCalc tool (see downloads) to provide economic and emissions metrics. Later Merit was only reserved for renewable matching as GenCalc was developed to quickly change CHP operation regimes from demand following, continuous, ON/OFF switching control plus included a convenient scaling functionality. Thus a study was performed with GenCalc to determine the optimum CHP working conditions (electrical following, heat following, base load electrical, base load thermal, base load electrical with on-off during off peak hours.) Another study for CHP included a water storage of 45,000l of hot water (80C-60C) that allowed save all the excess thermal energy that was dumped in Summer and Winter night with the off peak on-off function (electrical following – 100% of available energy use).
The PV supply options were based on Merit data for a BPsolar 1m2 for 4 typical solar days and GENcalc used to scale and analyse for different numbers of panels. The Wind Power turbines were based on Merit data for a NORDEX 600kW machine which was assumed to be equivalent to 240 2.5kW machines which could feasably be installed in our estate. GENcalc was used to generate and analyse options with different numbers of machines. For Solar thermal evaluation, a hot water profile was required - it was assumed that the summer thermal profile (no space heat likley) would be representative of the daily hot water profile over the year. A study was conducted with Merit, using 500 sq.m Flat Plate Collectors South facing, and an angle of tilt equal to the latitude. Storage was provided by a 5000 litres perfectly insulated tank.
Co-generation scenarios >
The approach taken involved investigating the following combined heat and power (CHP) operational options:
- base electrical
- base electrical, low tariff off
- base heat
- high tariff base electrical, low tariff throttle
- high tariff base electrical, low tariff off
- electrical following
- electrical following, 50% grant
- electrical following, low tariff off
- heat following
- electrical exporting (grid), low tariff off
- electrical exporting (dist network), low tariff off
- electrical exporting (private wire), low tariff off
- electrical exporting (private wire), low tariff on
- electrical exporting (private wire), low tariff on, 50% grant
The aforementioned co-generation scenarios can be split into two distinct categories of non-electrical export engines (in-situ) and export engines. Much of the time, the decision on whether to export or not is governed by external factors, so although we reach a specific conclusion on export, it may not apply to another estate. In light of this, we present much of the method of selection and the use of the metrics from GenCalc, highlighting all the inbetween the options on our way to a solution.
For each option, a triple-E (energy, economics & environment) assesment was undertaken and the optimum financial (payback & NPV), primary energy & CO2 options highlighted and inserted into a performance viewer. The three E's were felt to be important indicators for real world decision making and also it helps keep an objective view from whatever angle you may look at the supply of energy to an estate.
CHP in-situ >
Base electrical operation:

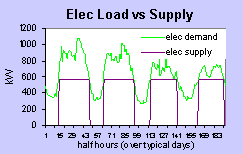
From the demand-supply profiles (above) it is apparent that dumping of heat is necessary under base electrical operation. GenCalc outputs (below) illustrate the effect this heat dumping has on carbon savings and the cash-flow from the regime. The dumping of thermal energy begins to shift the situation towards that of a traditional power station (40% grid efficiciency assumed) and the financial situation even turns negative, exacerbated by the low over-night electricity tariff available.

Thus the analysis points us in the direction of on/off switching overnight during low-tariff in order that we may improve the operating economics of the co-generation plant. When this is undertaken the co-generation plant pays back over 1 year quicker. However, now the engine displaces less of the grids electricity and therefore the saved CO2 emissions per annum are lower.
In reality, a co-generation plant switching off at night would have it's capacity sized for the day-time base and rather we would want to compare with that scenario.
On-Off switching & low tarrif - base electrical (day-time) operation:
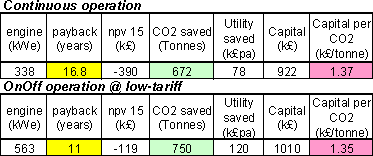
The operating profile for the day-time base electrical engine is shown below and illustrates how more of the expensive electricity is being off-set. In energy & CO2 terms too, the increased day-time energy capture is greater than that lost by switching off overnight (17% primary energy savings compared with 15%). The table below quantifies this in terms CO2 and shows the vastly, improved payback, exacerbated by the day-night tariff differential.
Electrical load following operation:
 The previous on/off switching case clearly benefitted from the high day-time base load that was available, which a load following machine could take further advantage of.
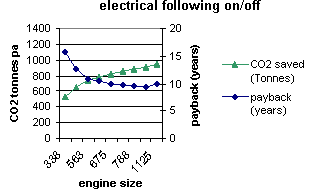
The question really is: Is it worth paying the extra for an engine with peak load capacity that will only be utilised for a short period of the day? Generally, there will be an optimum where the extra cost associated with plant size will balance with the increased electricity saving. The plot opposite shows how the optimum is found.
In our case, the daytime load is fairly steady and so conditions are favourable for a high engine capacity. Indeed the optimum engine capacity for financial payback occurs slightly below peak demand at 844kW, where heat dump is still low. CO2 emission savings continue to improve with engine size up till the peak demand as a result of the low heat rejection - much lower than that of a power station across all seasons.
In-situ Co-generation Comparison >


In this graphical metric, the closer the triangle vertices are to the origin (smaller the triangle), the better the option in terms of primary energy, financial payback & emissions.
CHP - export >
 There will be an optimum engine size which occurs for export situations (see export scenario data tables). In terms of a financial optimum, the pertinent factors are the increased capital costs associated with larger engines, export tariffs and the reducing utilisation potential for the heat produced. In terms of energy and CO2 emission optima, the latter factor is key in determining when an estate begins to attain no extra benefit from generating more power.
Electrical exporting (grid), low tariff off:
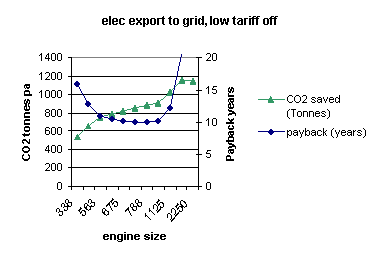 The obvious way of exporting electricity is to sell it back to the grid. It is common that you will get a lower price for the export electricity than that you import (1.5p/kWh versus 4.5pkWh). For a fuller consideration of the costs involved reference should be made to the CHP section in the framework. An engine scaling analysis enables determination of the aforementioned optima, presented in the plot opposite (see data tables). The financial payback can be seen to reduce up until an engine size of about 733kWe, where the extra capacity results in a higher capital outlay and a reducing cash flow over summer and weekends due to excess heat dumping. In terms of primary energy and CO2 emissions the optimum plant occurs at a capacity of 1688kW, 70% greater than the peak demand. It is at this point that the extra electricty generation effectively occurs at an efficiency less than that of the grid. From the perspective of primary energy & CO2 emissions the engine would benefit further from running over night, however would do so at an additional financial loss due to the low overnight electricty tariff, explained earlier in the in-situ generation scenarios.
 Electrical exporting (dist network), low tariff off:
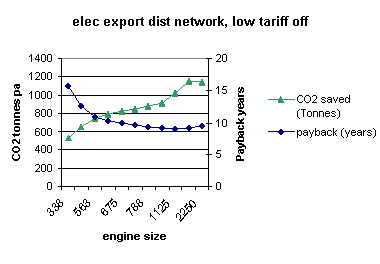
Another variation on the previous scenario is to rent out the estate's local distribution network from the DNO (if appropriate). In this way you are a liberty to charge a higher price for the electricty you put onto that network. After the rental price is taken into accout a favourable tariff of 3p/kWh can be obtained.
As a result the financial payback is reduced and a new otimum is available at a greater engine size. As this is a purely financial manipulation, the optimum plant size in terms of CO2 emissions and primary energy remains as before, when grid efficiency is encroached (see data tables).
Electrical exporting (private wire), low tariff off:
 Taking this scenario one stage further, consider buying out the estate's local distribution network from the DNO (for a consideration of the costs involved reference should be made to the CHP section in the framework) In this way you are able to charge the full price for electricty you put onto that network (4.5p/kWh). Again this is a purely financial manipulation - the optimum plant size in terms of CO2 emission savings and primary energy savings remains as before. Now though you are producing power under a better economic climate than the grid - same tariff sale, none of the normal distrribution charges or transmission charges, plus utilisation of waste heat.
As a result the financial payback is reduced and the optimum is infact off the scale (reached when the efficiency of the co-generation plant becomes so low that its financial effects counteract the enhanced economic climate)(see data tables).
Renewables >
Mature renewable technologies - photovoltaics (PV), wind power & solar hot water (SHW) - were investigated via GenCalc, using daily supply profiles from MERIT.
Photovoltaics
The PV supply options were based on Merit climate data for BPsolar 1m² panels for 4 typical solar days. The maximum panel area envisaged for the case study was 10000m² (i.e. 1/6th of floor area).
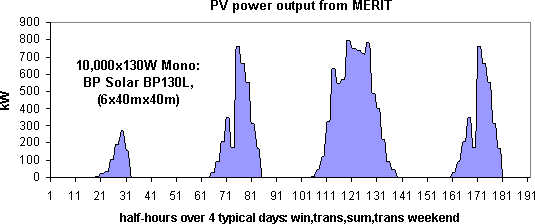

GENcalc was then used together with costing figures based on industry data (see framework) to scale and analyse for different numbers of panels.

These options were then input to a chooser for evaluation against other supply options.
Wind turbines
As stated in the framework there are many possible options for implementation of wind generation in our case study. The actual options that are feasible will depend on the constraints of the site. As the campus is a city centre location we assumed that the maximum we would be able to install would be 600kW of wind power capacity. This could be configured as a single 600kW turbine or as the equivalent in smaller turbines (240 2.5kW turbines for example). The sites of the turbines would need to be considered carefully and noise, vibration, visual impact, structural feasibility carefully analysed. The case study used the wind data for the Glasgow region (from MERIT) and the performance data for a Nordex 600kW machine (also from MERIT) to provide the supply profile corresponding to the maximum capacity scenario.
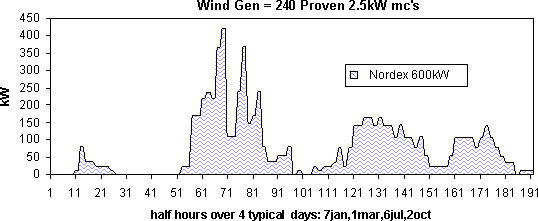

GENcalc was then used together with costing figures based on industry data to generate supply options based on a smaller, realistic deployment of renewables.

These options were then input to a chooser and evaluated against the other supply options.
Solar Hot Water 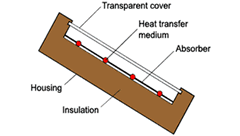
The SHW supply options were initially appraised upon a 500m² flat panel solar collector with a £500/m² capital cost (30% of this covered by grant) - see framework for background. The SHW output profile was generated based on MERIT climate data for Glasgow and an appropriately sized thermal storage tank (5000litres) was assumed. The demand/supply profile for this installation was produced and the key performance metrics from GENcalc assessed, shown below.

An enlarged scenario was analysed with a 2500m ² flat plate collector, £200/m ² capital cost. The demand/supply graph was again produced along with key metrics, shown below.

For both the scenarios it is clear that the solar hot water does not look financially attractive but can potentially make a significant CO2 contribution if boiler gas is displaced. However as we eventually select a CHP solution in our case study which generates excess heat in the summer and there is no boiler gas being used then, the SHW system would serve no purpose in combination with CHP on our estate. This situation could change is a use could be found for the heat e.g. export to neighboring leisure centre swimming pool.
Evaluation >
To evaluate the energy effective options above, a "chooser" is used within GenCalc to compare the options across economic, energy & emission categories, allowing for a ranked appraisal to be made depending upon your particular drive as an energy manager - followed by our recomendations in the subsequent section.
Financial view

The best CHP option is export of electricity to private wire customers (npv[15yr] £1,363,000 payback 5.3 years). If 40% Grant is achieved this greatly enhances profitability (npv[15yr] £2,048,000, payback 3.1 years). It is decided that energy saving options make financial sense with paybacks less than 10 years. Renewable energy options have paybacks greater than 15 years and are not financially attractive even with 50% grants.
Green View

The best CHP option is the export of electricity to private wire customers (npv[15yr]£820,000, payback 6.2 years). If 40% Grant is achieved this greatly enhances profitability (npv[15yr]£1,503,000, payback 3.5 years). Renewable energy options can make significant CO2 savings. Energy saving options also make significant CO2 savings.
Conservative View

Energy savings options make best CO2 savings per £ capital spend. Electrical load following CHP option gives best CO2 saved per £ capital spend. It also avoids risks associated with export of electricity and heat, which may be considered prohibitve in a conservative organisation. Nevertheless the in-situ CHP option is still expensive (£1.1M or £0.67M with 40% grant), which may lead to it being dropped in a very conservative approach.
Energy Tycoon Approach >
Rather than the very single-minded approaches previously, the route recommended by the Energy Effective Estates (EEE) team is the "Energy Tycoon" approach. This focuses around the idea of quickly generating profits from energy effectiveness that then allow you to re-invest in other initially less finacially viable options - a wide portfolio of energy effective technologies is then attained. Positively this approach inherently selects options which provide large energy and emission savings, but negatively it generally involves high capital outlay initially.
To select the best technology to start this process off, we need to know what makes most savings and pays back quickest, so we determine the best option in terms of the net present value after 15 years (npv[15yr]):

The best profit making option is to establish electrical export CHP over private wire to maximise "npv(15yr)" and generate positive cash-flow as soon as possible. (npv[15yr]= £2,048,000, payback 3.1 years with 40% Community Energy grant). We have then recommended to pursue small scale renewables initially for marketing value to win over hearts and minds, complimenting energy management in the motivation of estate users whom will have a major effect on energy effectiveness through good houskeeping.Other than that you should pursue energy savings options in order of "npv(15yr)" or as opportunity occurs and try to expand practices across other parts of your estate (look for further revenue streams from electricity or heat sales). Importantly continue to review options as the situation progresses and changes.
Energy supply company, ESCO structure >
As a vehicle for undertaking the "energy tycoon" approach, an energy supply company based upon the ESCO structure detailed in the framework is chosen. This has a number of practical benefits to it:
- autonomy from university allowing full grant access
- liberty to mix private/public capitals easily
- qualifies for tax breaks
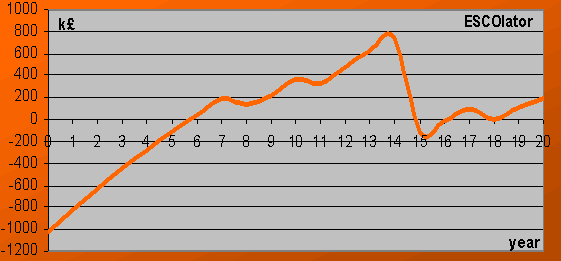
The financial projections of the ESCO are analysed with the "Financiator" tool to ensure its financial health and determine the extent of its positive benefit. The cumulative NPV projection is used for this purpose, based upon annual cash flows. The portfolio of initiatives selected for analysis is as follows:
- CHP private wire export (year zero)
- 8 wind turbines & 100sq.m PV (year zero)
- All energy efficiency measures on chooser [ranked by NPV] (year eight)
- CHP overhaul - self financed from profits (year 15)
- Wider deployment of renewables (year18)
- 18+ years -> At liberty to expand and invest profits where desired
ESCO Cumulative NPV Projection
To recap the route to this solution, we utilised
- the FRAMEWORK as guidance.
- ENcalc for demand reduction analysis. GENcalc for generation supply selection.
- the Chooser to compare and select. ESCOlator to assess economics.