Amongst the considerations early in the development of a building design, the designer is concerned with two issues:
The LT Method (LT standing for Llighting and Tthermal) is an energy design tool for non-domestic buildings which has been developed expressly for this purpose. The LT Method uses the concept of passive and non-passive zones. Passive zones can be daylit and naturally ventilated and may make use of solar gains for heating in winter, but may also suffer overheating by solar gains in summer. Non-passive zones have to be artificially lit and ventilated, and in many cases cooled to prevent overheating due to internal gains.
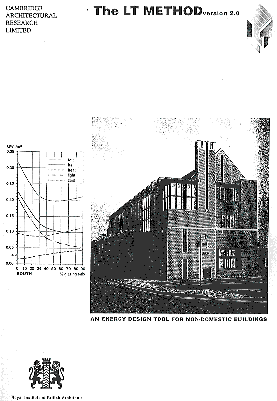
The LT Method is a simplified design tool in the form of a set of graphs. The LT Curves give the total primary energy consumption per square meter of the North, South and East/West orientations of the facade. Individual curves are given for cooling, lighting, and heating; a total energy curve combining all of these is also given. Curves are provided for two climatic zones. The definition of the climatic zones is not by geographic location but by monthly average temperature. About two thirds of sites in southern Europe fall in to two zones. For other areas the curves may be extrapolated.
The LT Method calculates energy as if the building were air-conditioned, and therefore the potential cooling energy load, this responds to certain load reducing measures such as appropriate glazing area and shading. Further reductions by passive cooling techniques, which are not evaluated by LT, may remove the need for mechanical cooling altogether.
It is important to understand that the LT curves give annual energy use. Reductions in
glazing ratio and consequent reduction in daylighting, will cause a faster climb in the
lighting curve than the fall in the cooling curve due to reductions in solar gain. This is
because the lighting demand is all year round, whereas cooling demand is seasonal. LT
Curves do not give a true indication of daily cooling load or overheating.