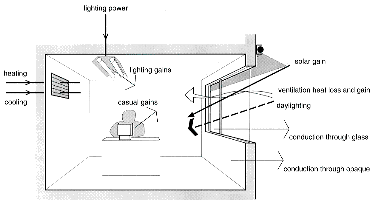
In the LT Method, energy use is read off from graphs. These graphs, The LT Curves, are derived from computer-based mathematical model. The energy flows considered are indicated below.

First, the model evaluates the heat conduction through the external envelope, and ventilation heat loss (or gain). Using monthly mean temperatures and an average internal temperature with a correction factor to allow for intermittent heating, a monthly gross heating load is calculated. The model then evaluates the solar gain and applies a utilisation factor to this. This factor takes account of the fact that not all of the solar gains available are useful in offsetting auxiliary heating.
At the same time the monthly hours of available daylight are calculated from the average hourly sky illuminance on the facade, the daylight factor, and an internal lighting datum value. This gives a monthly electrical consumption for artificial lighting and a monthly heat load.
The lighting heat gains and useful solar gains, together with causal gains from occupants and equipment, are then subtracted from the gross heating load to establish the net heating load. If the gains are more than the gross heating load, then the net load is zero. For air-conditioned options, it is necessary to evaluate cooling loads. If the gains are sufficient to raise the average temperature above the cooling set point, then a cooling load exists. This cooling load is added on to a fixed energy demand for fan and pump power.
Note that the model assumes 'sensible light-switching" i.e., that lights are only on when the daylighting value drops below a minimum datum value. In practice this would almost certainly require automatic light-sensing switching. Thus, the model already assumes a considerable degree of good design, and evaluates a technical potential performance, rather than the actual performance that would probably be found in a typical, but wasteful building.
The monthly energy consumption is calculated for a 'cell' and then reduced to the value of energy consumption per square metre. This is then totalled for the year and plotted as a function of glazing ratio. A Cell corresponds to a room surrounded by other rooms. This implies a zero conductive heat loss through all surfaces except the external (window) wall or, in the case of rooflighting, the ceiling. Appropriate efficiency factors are applied to reduce all energy to primary energy.
The reason that primary energy is used is that it allows the different 'fuel' inputs for lighting, heating and cooling to be reduced to one common unit. Primary energy is the energy value of the fuel at source. In the case of fuels such as gas or oil used for heating, there is a small energy overhead required for extracting, refining and distribution. There is a rather larger loss of heat energy at the point of use due to combustion losses. This typically results in a value of about 1.5 for the ratio of primary to useful energy.
In the case of electricity, and energy overhead occurs at the power station due to thermodynamic efficiency of the conversion of heat to mechanical power. This leads to a high ratio of primary to delivered energy, of about 3.7 when used to produce heat, electricity converts with 100% efficiency which results in the overall primary to useful ratio remaining at 3.7.
For energy sources which are fossil fuels, primary energy relates well to CO2 and other pollutant production, and to cost. Problems would arise however, where a substantial proportion of the electricity is generated by renewable (mechanical) sources such as hydro or wind. It also presents problems where electricity is generated by nuclear sources since the concept of primary nuclear energy is not really equivalent to primary energy of conventional sources. However, nuclear energy is not free from CO2 production. The energy of construction, decommissioning, and waste fuel reprocessing is significant compared with the lifetime energy production of the plant. Primary energy is calculated here assuming a mix of fuels and electricity generation appropriate for the European situation.
| Site location | Southern Europe | ||
|---|---|---|---|
| Orientations | S, E/W, N, Horiz. | ||
| Room Height | 3 m | ||
| Glazing ratio | 0-100% | ||
| Glazing bars, framing | 20% | ||
| Glazing type | double | ||
| Workplane height | 0.9 m | ||
| Reflectances | ceiling 0.7, wall 0.5, floor 0.25 | ||
| Illuminance datum | 100, 300, 500 lux | ||
| U-Values | external wall 0.6, roof 0.6, window 2.85 | ||
| Heating ref. point | 19oC | ||
| Cooling ref. point | 24oC | ||
| Heating efficiency | 0.6 | ||
| Cooling system CoP | 2.5 | ||
| Fan energy | 0.027 MWh/m2 (fresh air), 0.075 MWh/m2(air conditioning | ||
| Lighting power | 6, 12, 20 W/m2 |
| Building type | hours/day | day/wk | vent. ac/h | light lux | int. gains W/m2 | ||||||
|---|---|---|---|---|---|---|---|---|---|---|---|
| Residential | 8 | 7 | 1.5 | 100 | 8 | ||||||
| Office | 10 | 5 | 1.5 | 300 | 15 | ||||||
| Retail | 10 | 5 | 1.5 | 500 | 25 |
| Primary/Delivered energy | |||
|---|---|---|---|
| Heating | 1.05 | ||
| Electricity | 3.7 |
About 2/3 of sites in Southern Europe fall into one of these categories. A substantial number of sites experience the higher winter temperature with the lower summer temperature and vice versa. This can be allowed for by using the appropriate curves from both zones.