Levelised Costs, CO2 and Land Use
To draw comparisons between each of the scenarios for the purpose of assessing feasibility, it was decided that it was necessary to select the most important outputs and apply them together.
The three main factors which were deemed to be most vital for this task were cost, CO2 emissions and land use required. For example, one scenario may reduce carbon emissions to zero, but it could also be the most expensive option which also requires more land than is available.
The three main factors which were deemed to be most vital for this task were cost, CO2 emissions and land use required. For example, one scenario may reduce carbon emissions to zero, but it could also be the most expensive option which also requires more land than is available.
Levelised Costs
To calculate the costs associated with each scenario, we used the help of a government study (DECC, 2013) which was conducted for this very purpose. It considers all costs throughout the lifetime of a technology: planning, construction, operation, maintenance and decommissioning costs, and also the expected energy output over its lifetime to calculate average £/MWh.
With this average cost figure calculated per technology, we were able to apply this to each scenario by assessing the energy outputs from each (rather than using the capacity figure which we input to the model, as in most cases the results showed that these extremely high levels would not be required).
It is important to note that levelised costing is a very rough method of calculation, which comes with some limitations (DECC, 2013, p13) in the first place. But on top of this, we are projecting quite far into the future using today's cost values which will have additional inaccuracies. It is entirely plausible that should such high levels of installation of these renewable technologies actually be realised, that their costs would come down considerably. The assessment we carried out was only to give a rough feel for a comparison, there was not enough time to investigate ways to estimate future energy costs.
CO2 Emissions
These values came directly from our EnergyPLAN results.
For full details of these figures, please see the Results Assessment page.
For full details of these figures, please see the Results Assessment page.
Land Use
Land use requirements for each scenario were calculated on an installed capacity basis. This means that every onshore generation technology (e.g. solar PV, nuclear, ...) was assigned a km2/MW coefficient, which was then multiplied by the corresponding capacity for every scenario to get its land use demand. The latter were later on added up together to get the final value of square kilometres required.
The aforementioned coefficients (with the exception of pump hydro generation) were taken from the work carried out by Fthenakis and Chul Kim (2009), who compared the land transformation and occupation within a life-cycle framework , including fuel cycles, thus accounting for both direct and indirect usages. This reference was selected as it considered the most comprehensive definition of land use in the literature. Finally, the coefficient for Pump Hydro Storage was obtained from calculations using real data from Cruachan power plant and estimations for a new potential power plant in Loch Sloy (MacKay 2008).
Figures of installed capacity were taken directly from EnergyPLAN results. It was assumed that the installed capacity for every generation technology would be equal to the maximum instantaneous power delivered by that technology.
Finally, global land use results were compared to the total surface area of the UK (243,610 km2). Results for scenarios considering wind lulls (conservative approach) are shown in the table below:
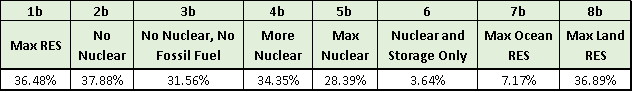
Table 1: Scenario land use requirements (% relative to total UK area)
With all of the above figures calculated, we created a graph to allow a simple visual assessment as can be seen below. Each scenario can be identified by the number on the bubble. The central position indicates the carbon emissions and levelised costs, with the diameter of the bubble showing the land use as a percentage of the total land in the UK (see Table 1 above).
As can be seen, the majority of the scenarios fall within a fairly narrow cost band (in the region of £115-£140/MWh), with a much broader range of CO2 emissions from almost zero up to around 55Mt.
The most desirable location on the graph is bottom left, and of course the smaller the bubble diameter the better. Scenario 6 (Nuclear and Storage Only) sits within this area whilst also possessing the smallest diameter. So it appears that this is the optimal solution out of them all, however as previously mentioned, the costing calculations are far from accurate and therefore this should only be taken as a general indication.
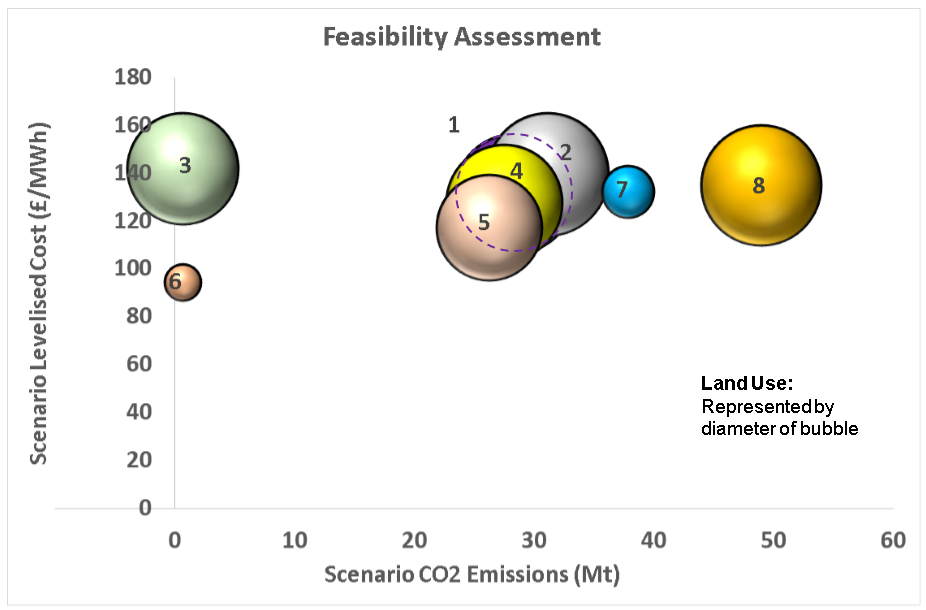
Figure 1: Scenario Feasibility Assessment
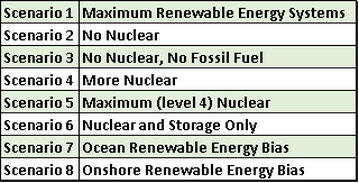
Figure 2: Scenario Descriptions
Environmental Impact Magnitude and Importance Determination
Significance determination in Environmental Impact Assessment (EIA) practices refer to the judgements about what impacts are important, desirable or acceptable and their significance magnitude (Sippe 1999, Stamps 1997). Also, in EIA, the significance determination of the impacts interprets the degrees of importance (Lawrence 2007b).
G. Wood defined in "Thresholds and criteria for evaluating and communicating impact significance in environmental statements" (Wood, 2008) four degrees of Significance Criteria:
In our feasibility study we have used Wood's criteria to score the magnitude for the different impacts generated by the various low carbon technologies present in the 2050 supply scenarios.
Additionally, the importance of the impacts is also scored, placing the different magnitudes in comparison to the relevance of the impacts. The importance depends on the area of influence, the persistence of the impact, the societal value, the percentage of resources affected and their status as well as their resilience.
We have set our own scoring system, which gives a value from 0 to 10 to the different impacts.
G. Wood defined in "Thresholds and criteria for evaluating and communicating impact significance in environmental statements" (Wood, 2008) four degrees of Significance Criteria:
- No significance or negligible
- Low significance
- Moderate significance
- High significance
In our feasibility study we have used Wood's criteria to score the magnitude for the different impacts generated by the various low carbon technologies present in the 2050 supply scenarios.
Additionally, the importance of the impacts is also scored, placing the different magnitudes in comparison to the relevance of the impacts. The importance depends on the area of influence, the persistence of the impact, the societal value, the percentage of resources affected and their status as well as their resilience.
We have set our own scoring system, which gives a value from 0 to 10 to the different impacts.
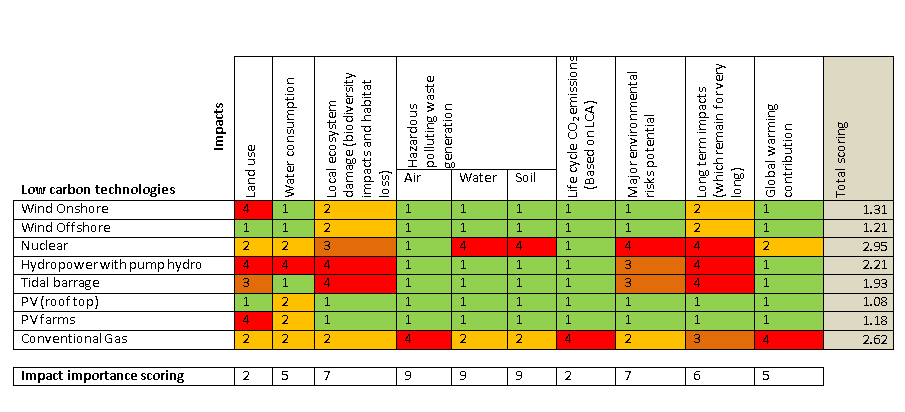
Table 1. Environmental impact magnitude and importance for each low carbon technology
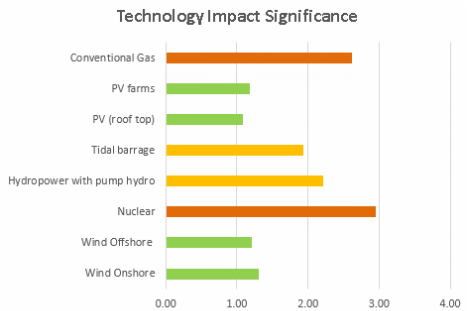
Figure 1. Technology Impact Significance
2050 Supply Scenarios Environmental Feasibility
Also we present the overall environmental assessment for the different 2050 supply scenarios, taking into account the different technologies contributions and the impact significance score for each of the technologies.
As expected, Scenario 3 (No nuclear and No Fossil Fuel) has the lowest environmental impact significance in contrast with Scenario 6 (Nuclear and Storage Only) with a moderate significance according to Wood's Criteria.
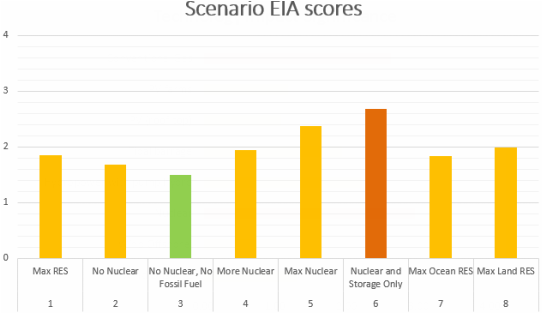
Figure 2. Environmental Impact Assessment for each 2050 Supply Scenario
Summary of Feasibility Assessment results
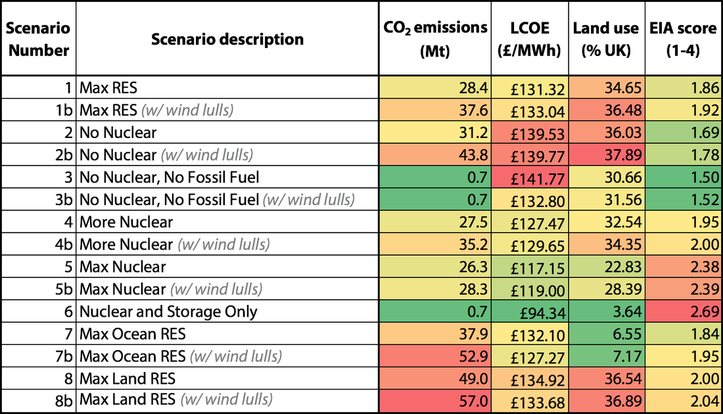
The table above gathers all the results coming from the feasibility assessment. Traffic-light rating system is used to highlight the relative performance of each scenario (in rows) for every variable appraised (in columns).
We consider this table may be a handy tool for quickly identifying the benefits (in green) and drawbacks (in red) for every scenario.
We consider this table may be a handy tool for quickly identifying the benefits (in green) and drawbacks (in red) for every scenario.
References:
IPCC, 2011. Special report of the Intergovernmental Panel on Climate Change. Renewable Energy Sources and Climate Change Mitigation. Summary for policymakers and technical summary.
Lawrence, D.P. 2007b. Impact significance determination – Back to basics. Environmental Impact Assessment Review, vol. 27:8. S. 775-769.
Sippe, R. 1999. Criteria and standards for assessing significant impacts. Handbook of Environmental Impact Assessment, vol. 1 – Environmental Impact Assessment: Process, Methods and Potential. Petts, J. (ed.). S. 74-92.
Stamps, III AE. 1997. A paradigm for distinguishing significant from non-significant visual impacts: theory , implementation, case histories. Environmental Impact Assessment Review, vol. 17:4. S. 249-293.
Wood, G. 2008. Thresholds and criteria for evaluating and communicating impact significance in environmental statements: ‘See no evil, hear no evil, speak no evil’?. Environmental Impact Assessment Review, vol. 28:1. S. 22-38.
DECC, 2013. Energy Generation Costs.
V. Fthenakis and H. Chul Kim (2009), Land use and electricity generation: A life-cycle analysis.
Scottish Power (n/a), Cruachan Power Station.
David J.C. MacKay (2008), Without the Hot Air; UIT Cambridge.