Parameters Definition
As highlighted in the previous section, this study uses a scenario-based approach, a scenario being made up with the following parameters:
For our study, we chose to fix some of these parameters and to vary the others. Here are the one we fixed whatever the scenario we were running.
In the rest of this section, the varying parameters will be explained, as well as the reason of their impact on the viability of the system. Components Efficiencies
Assessing the efficiencies of our system's components was an important part of the project. Everyone of them has its own characteristics and therefore its own efficiency. More details about these efficiencies are available here.
Demand patterns
One of the first and crucial element we had to consider was the type of demand a peak power plant has generally to cope with. In addition to the information we could get from the National Grid STOR (Short Term Operating Reserves) scheme, we studied the National Grid demand data for all the year 2015 [4]. As an example, here is the United Kingdom demand for the month of December 2015.
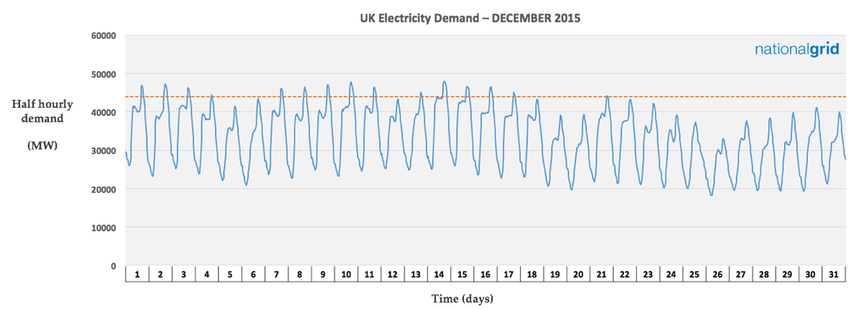
Source: http://www2.nationalgrid.com/UK/Industry-information/Electricity-transmission-operational-data/Data-Explorer/
We can easily notice a lot of ups and downs in the demand, reflecting both a daily and a weekly fluctuation of the electrical demand in the UK. We can also notice that depending on how you choose to define the peak time limit (demand from which a peak power plant is called upon - materialized by the orange line on the graph above) you can define different calling patterns for such a plant.
For our project, we chose to define and use three different demand profiles, that we qualified as Aggressive, Moderate, and Light. Each of them representing a different calling pattern.
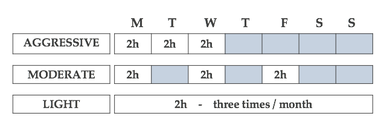
The demand profile chosen for a scenario will impact the cost-effectiveness of the system in two different ways:
Buying price of electricity
As we refill our storage system by buying electricity from the grid, the price at which we purchase this electricity is a very important element in terms of cost-effectiveness. You will see here that there is two different parameters influencing this price: the time available to refill the system (depends on the demand profile) and the time needed to refill the system (depends on the size of the electrolyser and the compressor). In order to define the buying prices of our scenarios, we carried out a statistical analysis on the pricing data of 2015.
Let's have a look to the electricity pricing data for the month of December 2015. As the demand data, the pricing data fluctuates a lot, going even sometimes (rarely) down to zero or negative prices. [5] 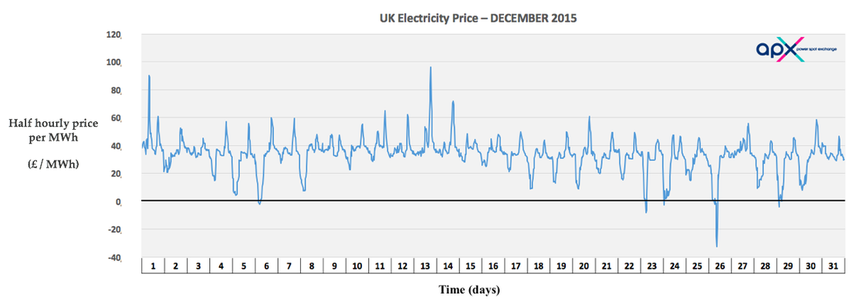
Source: http://www.apxgroup.com/market-results/apx-power-uk/ukpx-rpd-historical-data/
Available: ftp://ftp.apxgroup.com/ Then, how does these two parameters influence the buying price of electricity ?
- Time available to refill: Time between to consecutive calls. The system has to be refilled in this amount of time. Considering the 3 demand profiles defined previously, here are the average times available to refill. 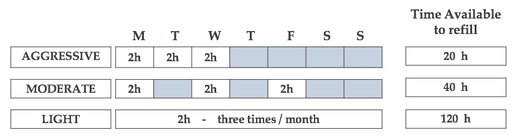
The first interesting point is that, the more time you have available to refill, the more you can take advantage of the price fluctuation by choosing among the cheapest hours to refill your system. - Time needed to refill: Minimum time that the electrolyser needs to fully refill the system. Indeed, depending on the size of your components (mainly the electrolyser and the compressor), your system will be able to refill the hydrogen tank more or less quickly. For this study, we consider that the time required to refill the system varies between 1h and 20h. Finally, the quicker your system can refill the tank (due to good, and therefore expensive, equipment), the more you are able to choose cheap electricity among the available time you have to refill it. Let's take two extreme examples. Example 1: We consider a Light demand profile, with 120 hours available to refill. We also consider that we have good equipments able to refill the hydrogen tank in 2 hours. Thus, we are able to choose 2 of the cheapest hours out of the 120 hours available. Based on the data of 2015, with these parameters, we should be able to buy electricity for £2.70 / MWh. Example 2: We consider a Light demand profile, with 20 hours available to refill. This time we consider that we have smaller equipments which actually need these 20 hours to refill the system. Thus, we have to buy the electricity whatever its price. Based on the data of 2015, with these parameters, we should be able to buy electricity for £39.40 / MWh. Applying the same method for the three demand profiles and for a wide range of needed refilling time, we calculated the buying price of electricity for various scenarios (see table below). 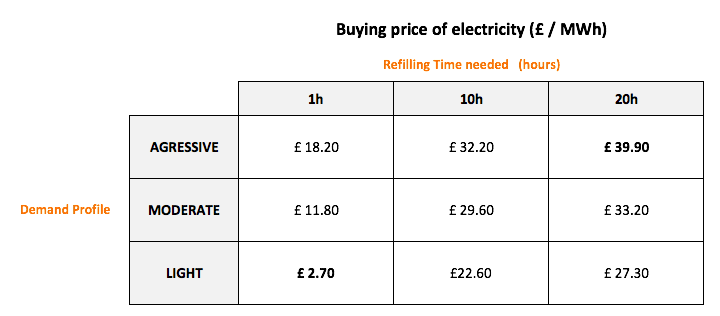
We have seen that the power of some components (the electrolyser and the compressor here) were impacting the buying price of electricity. The more expensive is the equipment, the better it is, the quicker it is, and the cheapest is the electricity you can buy. But does this low buying price of electricity worth buying very expensive equipments in terms of cost-effectiveness ? This highlight the importance of the capital cost estimation in this study. Required Capital Investment
Calculating the Required Capital Cost was one of the most challenging parts of our project, because currently there is not such a market available for big scale hydrogen storage system and for its components. In order to estimate the required capital cost of our system, we used both:
- Viacheslav Zgonnik (2011) [1] Here are few figures used for the calculation
According to Zgonnik, to produce 4.2 kg of Hydrogen in 24 hours, the cost of the electrolyser would be $ 28,789. Thus, to produce 295.9 kg in 24 hours, the cost of the electrolyser would be $ 2,015,230 which correspond to £ 1,411,522. With refill rate of 24 hr, we need to have an electrolyser with power capacity of 250 kW. With same logic, the compressor costs £1,759,100. - Utsira Experiment (2009) [2] 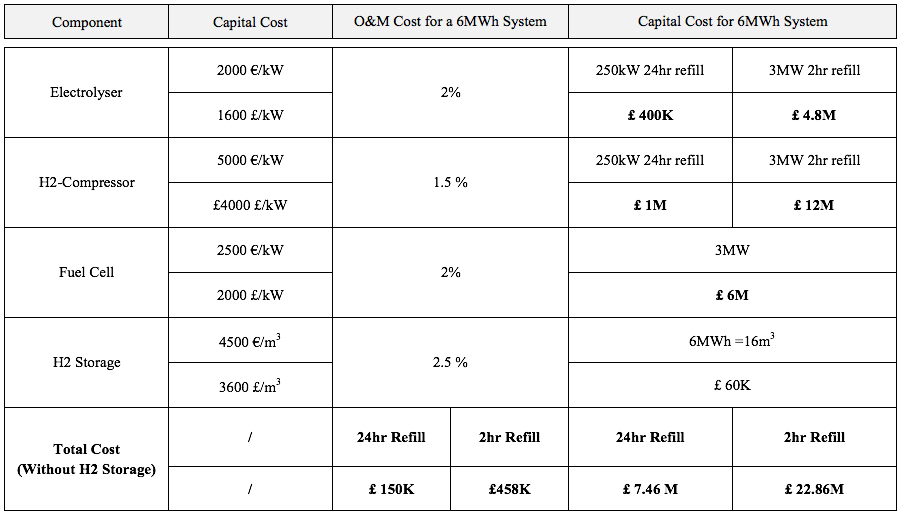
- Hydrogen Office [3] After completing literature search, we get in contact with Hydrogen Office[3]. There is a ongoing project which aims the deployment of big scale Hydrogen kit. Thus, it would be a great reference point to scale and define required capital investment cost for our project. Here are the characteristics of the equipment the Hydrogen Office is working with, for a cost of £ 1.4 M:
Each refueller costs £ 600,000 (including electrolysers, storage tanks, dispenser, ESS, installation and 5 years of maintenance). The 100 kW fuel cell costs £ 220,000. So we can easily assume that:
Then, it is safe to claim that Total Cost for 6MWh System (Capital Cost + 5 years of maintenance) is £ 6.6M. If we take “technological developments vs price decrease” into consideration since 2009, it is expected to see decrease in total cost of such investment. Therefore, the capital cost of a module of 6 MWh can be estimated as being in the following range depending on how fast the electrolyser is able to refill the system: 20 hr Refill Rate: £ 6.6M 2 hr Refill Rate: £ 22.86M The increase in the capacity of the system causes the decrease in the capital cost of every component. So, as a conclusion the range of total required capital cost is estimated to: £ 6-20 M. Concerning the Operation & Maintenance costs, we use the average of Utsira experiment’s: 2% of capital investment. [1] V. Zgonnik, S. Kolodych, O. Koniev, A. Korolyov, A. Sinitsyn, A. Osypenko, et al. (2011, 17 April). Residential refuelling with hydrogen. Available: http://www.hydrogencontest.org/pdf/2011/Kiev%20National%20University%20Entry%202010_11.pdf
[2] O. Ulleberg, T. Nakken, and A. Ete, "The wind/hydrogen demonstration system at Utsira in Norway: Evaluation of system performance using operational data and updated hydrogen energy system modeling tools," International Journal of Hydrogen Energy, vol. 35, pp. 1841-1852, 2010. [3] D. Hogg, "Technical Manager Bright Green Hydrogen / Levenmouth Community Energy Project / The Hydrogen Office www.brightgreenhydrogen.org.uk Personal Comunication (telecom and email correspondence)," Personal communication (telecom and email correspondence) ed: Technical Manager Bright Green Hydrogen / Levenmouth Community Energy Project / The Hydrogen Office www.brightgreenhydrogen.org.uk, 2016. [1] V. Zgonnik, S. Kolodych, O. Koniev, A. Korolyov, A. Sinitsyn, A. Osypenko, et al. (2011, 17 April). Residential refuelling with hydrogen. Available: http://www.hydrogencontest.org/pdf/2011/Kiev%20National%20University%20Entry%202010_11.pdf [2] O. Ulleberg, T. Nakken, and A. Ete, "The wind/hydrogen demonstration system at Utsira in Norway: Evaluation of system performance using operational data and updated hydrogen energy system modeling tools," International Journal of Hydrogen Energy, vol. 35, pp. 1841-1852, 2010. [3] D. Hogg, "Technical Manager Bright Green Hydrogen / Levenmouth Community Energy Project / The Hydrogen Office www.brightgreenhydrogen.org.uk Personal Comunication (telecom and email correspondence)," Personal communication (telecom and email correspondence) ed: Technical Manager Bright Green Hydrogen / Levenmouth Community Energy Project / The Hydrogen Office www.brightgreenhydrogen.org.uk, 2016. [4] National Grid. Historic demand data 2015. Available: http://www2.nationalgrid.com/UK/Industry-information/Electricity-transmission-operational-data/Data-Explorer/ [5] APX power spot exchange. (2015). UKPX RPD historical data Reference price data HH 2H 4HB 2015.xls. Available: http://www.apxgroup.com/market-results/apx-power-uk/ukpx-rpd-historical-data/Available: ftp://ftp.apxgroup.com/ |
H3P PROJECT - Modular Peak Power Plant
