O. Energy Map using a Geographical Information
System
|
Exercise purpose: |
To become familiar with the applicability of Geographical Information Systems for large scale energy management. |
|
|
|
|
1. start GIS tool |
Go to the 'Springburn'
(in |
|
|
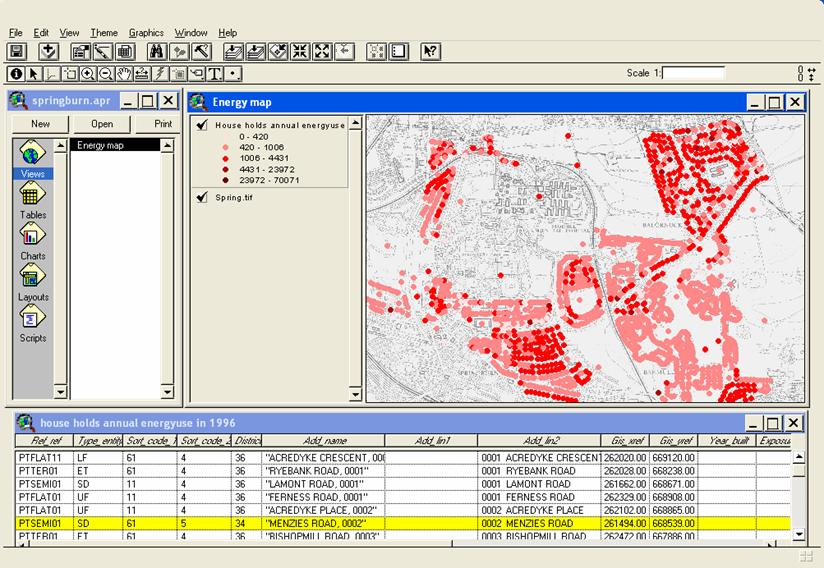
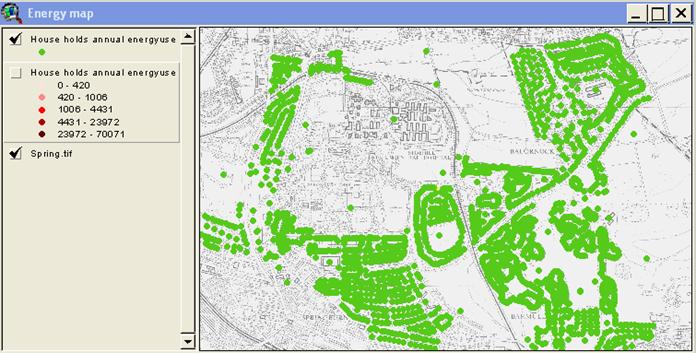
Select 'GIS view' under 'Exploratory’ menu, making sure that you are on the ‘Springburn’ scope map. A GIS tool (ArcView) is launched with a digitised map of the Springburn Area as seen below, where the distribution of annual households energy use is displayed. The data records table is shown at the bottom of the map. To see the description of the codes used in
the table (i.e. type_entity, sort_code_1 and sort_code_2
fields), click here.
|
|
|
|
|
2. Zoom-in/out |
Select 'Zoom In'
under the'View' menu or the
|
|
3. Identifying an entity |
Select the |
|
|
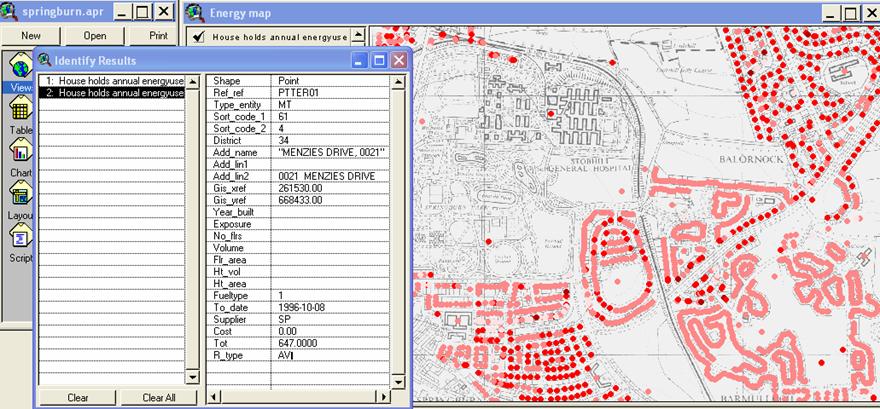
Click an entity on the map to view detailed information. You can see the address of the entity, type, ownership (refer to the code description).
You may have multiple entities at the same location, which means that there are many flats in the properties.
|
|
4. Select entities |
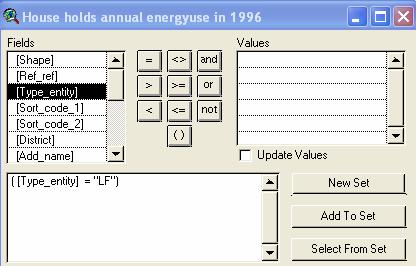
To select 'Semi-detached' properties in the map, you need to query the data.
Focus the ‘energy map’ window by clicking the Window frame. Select the ‘Query’ menu under ‘Theme’. Compose a query condition statement by selecting ‘Type_entity’ ,'=' and type 'SD', the code for the semi-detached building type. Note that you must use double
quotation mark (“) when you type ‘SD’ as seen below.
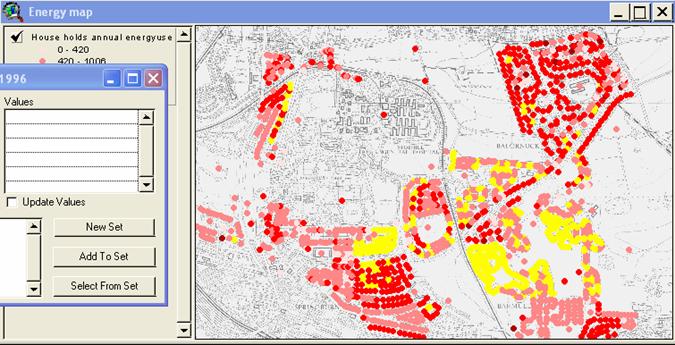
Then, select ‘New set’ which highlights the
selected properties as seen below.
|
|
4. Create a new map view |
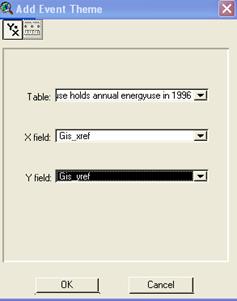
You can create a new map view by adding a new event theme in the existing map.
Select ‘Add event theme under the ‘View’ menu and then ‘house hold annual energy use in 1996’ in the ‘table’. Select ‘Gis_xref’ for the x-coordinate of the GIS reference system and ‘Gis_yref’ for the y-coordinate. You will have a new item in the ‘energy
map’ as seen below. You can select the new item
and unselect the current item to view it on the map.
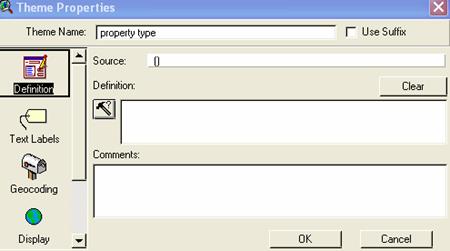
To change the name of the new
theme to ‘property type’, click the new item and open the theme properties by
selecting the ‘properties’ menu under the ‘Theme’ menu.
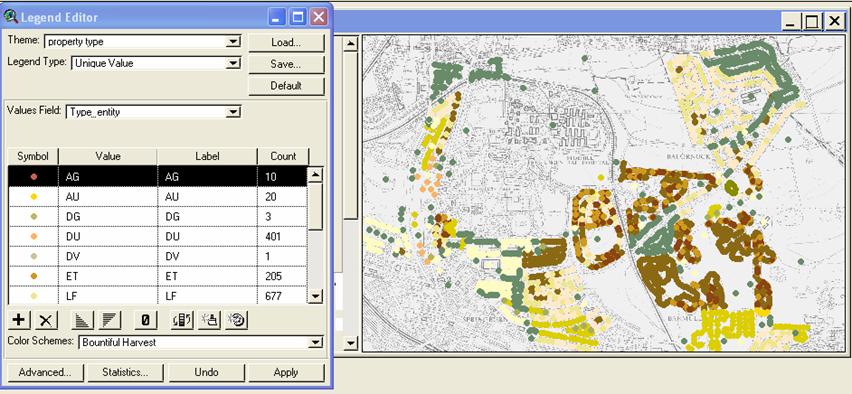
To view the property type in the map: - double click the ‘property
type’ theme (the legend editor popup window will appear); - select ‘Unique Value’ in the legend type field; - select ‘Type_entity’ in the Values field ( you will see the symbol
and count statistic according to the ‘entity type’ value as shown below); - (optionally) you can
change the symbol, colours and label names as you
wish; - click the ‘apply’ button.
|
|
6. Explore information |
Using the techniques
described above, explore the available information. |
|
|
|
|
|
|
|
|
|
|
Exercise result: |
The ability to manage GIS-based data visualisation. |