• Home
  • OVERVIEW
    • Motivation
    • Policy
    • District Energy
    • Main heat source selection
    • Case study: Kinlochleven
    • Methodology
  • THE PROJECT
    • Heat Demand Assessment
    • Network Modelling
    • Network Design
    • Assessment of potential renewable sources
    • Environmental Impact
    • Financial Assessment
  • CONCLUSIONS
    • Final review
    • Sensitivity Analysis
    • Further Work
  • RESOURCE CENTER
    • Acknowledgements
    • References
    • Downloads
  • THE TEAM
  • Home
  • OVERVIEW
    • Motivation
    • Policy
    • District Energy
    • Main heat source selection
    • Case study: Kinlochleven
    • Methodology
  • THE PROJECT
    • Heat Demand Assessment
    • Network Modelling
    • Network Design
    • Assessment of potential renewable sources
    • Environmental Impact
    • Financial Assessment
  • CONCLUSIONS
    • Final review
    • Sensitivity Analysis
    • Further Work
  • RESOURCE CENTER
    • Acknowledgements
    • References
    • Downloads
  • THE TEAM

Network Modelling

​The tool used to model the heat demand was the Carbon Trust Biomass Sizing Tool. This tool has been developed by the Carbon Trust in collaboration with Strathclyde University and the Campbell Palmer Partnership as an aid to those investigating not only biomass heating systems but also district heating systems in general.

Within the tool, all the different categories of buildings should be defined. Design day conditions corresponding to the coldest day of the year when the system operates at maximum load have to be specified in order for the tool to calculate the heat demand and size the main boiler, the thermal storage and the auxiliary boiler. Therefore, a heating profile for each building category is generated and then all of them are combined to generate the total heat demand profile.

The tool offers many ways of specifying all the different kinds of buildings. For each type of building the user is able to import energy and buildings data from four different input modes. The four input options are:
  • Data from a detailed building simulation program
  • Heat meter measurement data
  • Data from fuel bills
  • An embedded demand calculator requiring the input of detailed building data
 
Detailed Building Simulation Program or Heat Meter Measurements
This input mode can be useful if the user has already dynamic models of the different kind of buildings in other simulation tools as it is easy to extract data and import them in the Carbon Trust Sizing Tool. Otherwise, the user can collect heat meter measurements and then insert them to the tool.  It requires 24 hourly values of heat demand (load) at the design day to be collected. Therefore, this analysis was not considered to be suitable in our case.
 
Fuel Bill
Our analysis for the school in Kinlochleven was based on the Fuel Bill input mode which does not require a daily demand profile but can estimate the actual building demand based on fuel bill data for the design day of the year. Therefore after examining all the possible options this was considered to be the best option for this feasibility analysis.
 
In this case, the user does not have a daily demand profile, but can calculate the actual building demand based on fuel bill data for the design day, which was estimated to be 1.2% of the total demand for the year according to literature.
In order calculate the heat demand profile with the fuel bill method, the following data are required:
  • Site location
  • Climate data
  • Building Characteristics
  • Occupancy attributes
  • Ventilation attributes
  • Hot water demand
 
All the required inputs were acquired through an extensive investigation and are presented in the tables below:
Picture
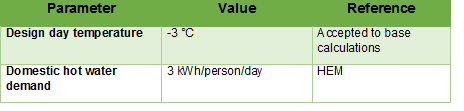
Parameters used in modelling
Picture
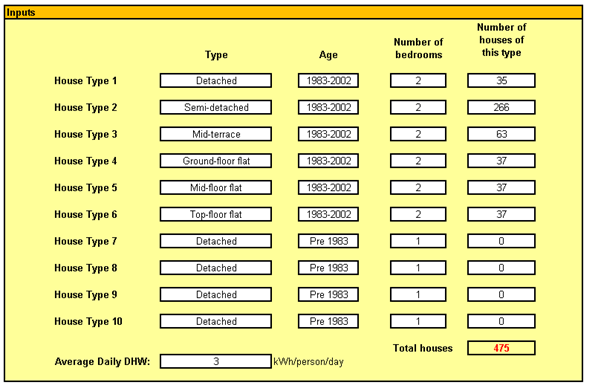
School modelling in Carbon Trust sizing tool
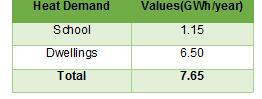
​At design day conditions, it was decided to shift the heating pattern of the school by operating the heating system from 05:00 instead of the usual 06:00. This will avoid excessive load to the system by the school on the coldest days of the year as well as additional costs of an oversized auxiliary boiler. This results in the heat demand pattern that can be seen in the graph below:
Picture
School demand shifting
​Embedded demand calculator
The analysis for the housing estates was carried out on the embedded demand calculator input mode which requires building data such as type of building, age, number of bedrooms and the number corresponding to each type to calculate the demand profile.
 
All the required inputs were acquired through an extensive investigation and are presented in the Table below.The data used to calculate Kinlochleven’s residential demand can be seen below:
Picture
Parameters used for housing demand modelling
Picture
Housing estates modelling
​The demand analysis performed with this tool results in an annual residential heat demand of 6.50 GWh.

Therefore, after completing all these kinds of investigation and modelling the team ended up with the following results and heat demand profile:
Picture
Total heat demand
Picture
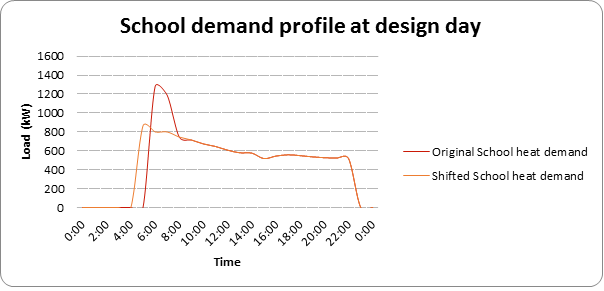
Design day heat demand profiles
Sizing of the district heating network
Based on industry common practice, the size of the main heating system was calculated to be 41% of the design day’s peak demand. Following this optimisation strategy, the obtained results and the fraction of energy served by the heat pump and by the auxiliary boiler can be seen in the table and graph below.
Picture
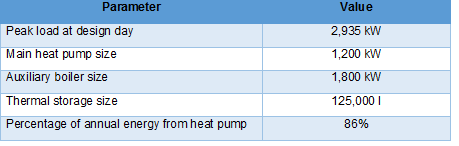
Optimisation results
Picture
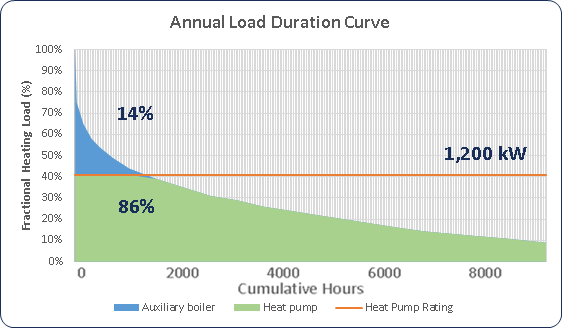
Energy served by heat pump and auxiliary boiler
On the coldest days of the year, the auxiliary boiler will be used to provide the fraction of energy supply that exceeds the rating of the heat pump. In order to miminise the use of the auxiliary boiler, a thermal storage tank is implemented, which will accumulate heat when there is a surplus –normally during the night time-, to be consumed when it is needed.

The size of the thermal storage is a key parameter in this analysis as increasing its size will increase the flexibility of the system and maximise the use of the heat pump and thus of the fraction of renewable energy. On the other side, a bigger thermal storage will increase losses and capital costs.
Thermal Store
Although the Carbon Trust Tool suggests a volume of network thermal store, this was dimensioned considering the CIBSE standard - Guide B1: Heating. Subject number 1.5.5.2 – Storage Systems, which recommends a volume of storage corresponding to a time recovery of between one and two hours, based on the system’s peak demand. Therefore, a recovery time of 1.5 hours was selected.
Using the following equation from the standard as shown below, the storage volume can be calculated.​
Picture
  • M: the mass of the stored water
  • Cp= 4.18 KJ/(Kg⋅K)
  • Θws – Θw1 = 30° C
  • Trec= 1.5 hrs
  • Φ= 2900 kW
The corresponding value for the heat storage was found to be 125,000 L.
Picture
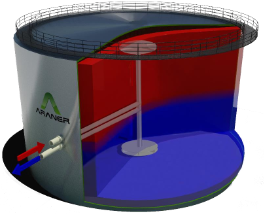
Stratified heat storage. Source: Araner                                    
Create a free web site with Weebly