
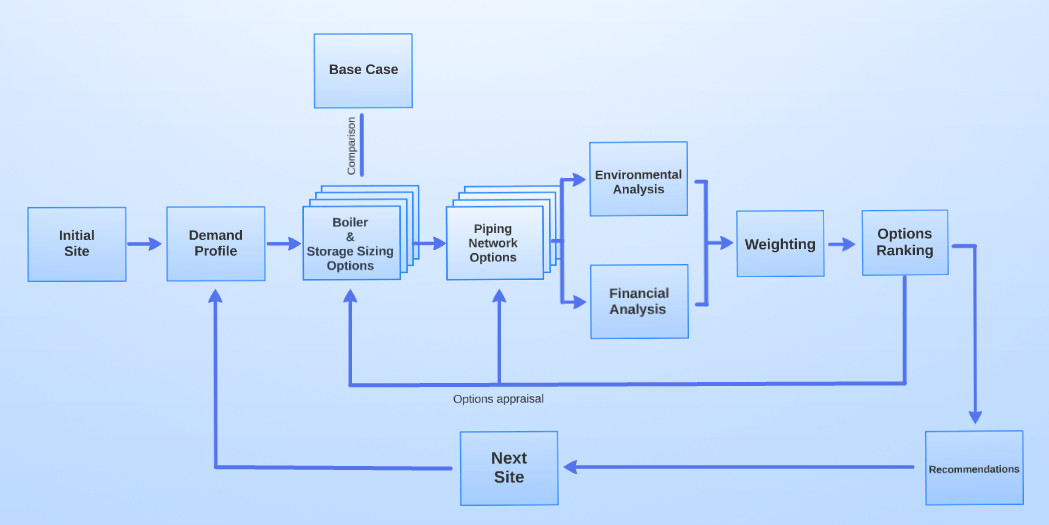


Methodology
Site Selection
Base Case
In order to make a comparison between different options a base case must be defined. This definition will depend on whether the buildings within the selected site are existing buildings or they are still on a proposal stage.
Existing building
Since the aim of the project is a feasibility analysis of biomass district heating networks, the base case for existing buildings will be the current heating system that is already in place to find out if changing the system is deemed feasible.
Proposed building
When the construction of new buildings is proposed, the base case will be defined as the heating system that is likely to be implemented according to local legislation and common good practices in that area.
Reasons for selecting DH site
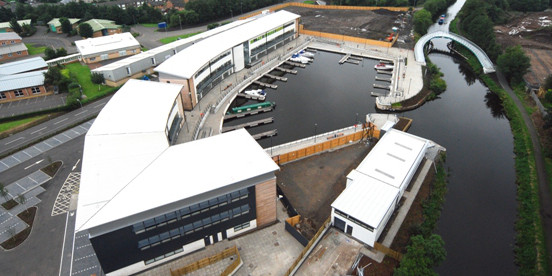
When selecting a potential site for biomass DH, the client should be aware of numerous criteria that will be required to deem the site feasible. The initial step is critical as basic background understanding of the required criteria is important to ensure that much time and resources is not wasted. Should a site justify the following criteria, there is a good chance that biomass DH will be a feasible option to meet heat demands via a renewable source;
High Heat Density
A high space and hot water heat demand density is imperative to making any DH network feasible. The Department of Energy and Climate Change (DECC) has produced a national heat map of the UK which may be used as a quick reference to heat densities within a town. As a rule of thumb, the annual average heat density of a group of buildings needs to be above 10,000kW/km2. Poor fabric and ventilation heat losses of clusters of buildings drive up a site’s heat density. This increases the opportunity to install a DH heating network if deemed more viable than individual building upgrades to reduce their heat demand. Techniques such as analysis of individual building billing information can determine a sites heat density. A review from an experienced engineer can often determine an approximation of heat density, prior to individual building modelling or simulation.

References:
DECC National Heat Map DECC Development Map
Poor Base Case Performance
High running and maintenance costs of the existing individual heating systems makes DH more financially feasible. This reduces the simple payback period of installing a new DH network. Poor carbon emissions of existing systems also ensure that a renewable energy driven DH network is more environmentally viable. Poor energy management and control will mean that a centralised energy centre will offer drastic benefits.
Specific Building Input Data
A lot of data about the existing buildings and operation is required to complete a feasibility analysis. This will be discussed for each individual tool throughout this website.
Feasible to Construct a DH piping Network
Studying a location and predicting local planning and construction barriers is important from the beginning. It should be noted that new construction of buildings makes DH more feasible as trenches etc. may already be being dug. This reduces capital investment and makes the project more technically viable. In terms of cost, urban construction of piping networks should be minimised if possible. Different piping layout may be examined using our piping design tool.
Potential Energy Centre Locations
There must be at least one practical energy centre location, situated as close as possible to the buildings within the scheme. Preferably, this should be located as close to the building or group of building with the highest heat demand. This reduced distribution costs and losses. Issues such as land area (energy centres may need a large land area due to large plant equipment and thermal and fuel storage), biomass transport issues and visual and environmental impacts from flue design need to be taken into account when selecting a prime boiler house location.
Individual Renewable Heat Generation Not Possible
Often a client has a desire or obligation to reduce carbon emissions. Biomass DH may be the best option to provide heat for numerous reasons (see Biomass DH Benefits).
Advancing to the second step of the methodology may be deemed pointless if all of these criteria are not met. These criteria should be used to determine individual buildings or clusters of buildings to make up a potential biomass DH network. Once the group of buildings has been selected, the methodology may be used to determine the feasibility of the project.
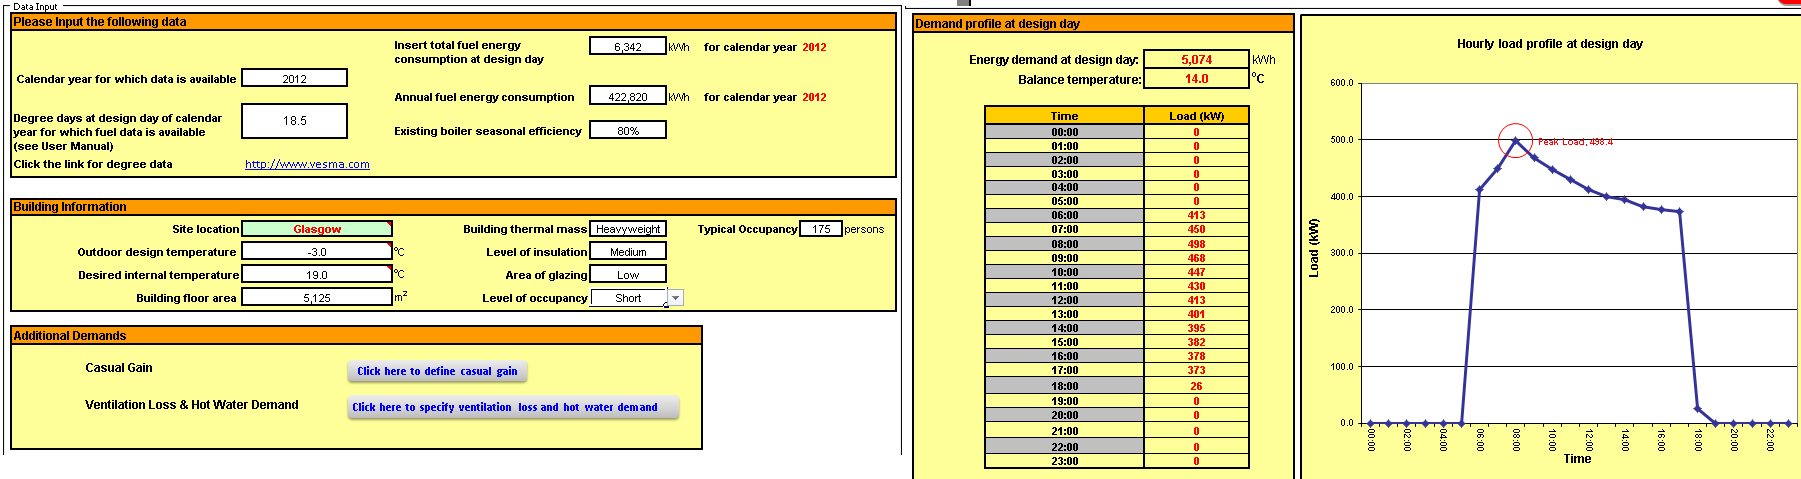
Demand Profile
The first design tool used to analyse the feasibility of biomass DH was the Carbon Trust Biomass Boiler Sizing Tool. Within this tool, a single design day (system designed off the day in the year at which the system operates at maximum heat load) load profile for all the buildings is required. From this, the biomass boiler and thermal storage may be sized. The design day heating load profile for each individual building is generated and then all of the buildings are combined to generate one collective load profile. There are numerous methods which may be used in order to generate the required design day load profile for the DH scheme. These are outlined below:
Detailed Building Simulation Programmes
Individual building results from modelling programmes such as IES (Integrated Environmental Solutions) may be imported into the carbon trust tool in order to generate the systems overall design day load profile. This is more suitable to detailed system design and not a high-level feasibility analysis. This is considered a good option for new builds, where input data such as building fabric U-Values and ventilation air change rates will be known.
Heat Metered Measurement Method
This method requires hourly fuel consumption measurement values for each individual building for the system design day. This level of smart-metering data is unrealistic to obtain in most case being considered for DH retrofitting. If a number of buildings are being controlled and monitored to this high level, the chances are they will not meet the site selection design criteria to begin with.
Fuel Bill
If a client is performing a high-level feasibility analysis on existing buildings then this is often the most logical approach. The client can adapt annual fuel consumption data from energy bills and a site visit to each individual building. From the site visit, the design team can approximate input values such as each building level of occupancy, thermal mass and thermal insulation. The Carbon Trust tool may then be used to generate the required system design load profile. This approach was taken for our case study analysis.
Embedded Demand Calculator Method
This offers a level of complexity and accuracy in between the Detailed Building Simulation method and Fuel Bill method. This is a simplified modelling process for each individual building within the Carbon Trust tool. Detailed levels of building information are required, such as exact element u-values and ventilation rates. This is often difficult to determine for existing buildings. This method does not take into account the billing consumption data. This method was disregarded for our case study as the billing data was considered to be the most concrete data we could obtain so it would be inaccurate not to take this into account. Also, the majority of the buildings had been operational for many years, so detailed simulation of current building and system performance would be based on too many assumptions.
Obtaining an accurate design day load profile is a difficult task. Often, many logical assumptions based on site visits have to be made if concrete information is impossible to obtain. This is often the case for older, existing buildings. Techniques such as basing assumption off Building Regulations at the time of the build can often provide solutions to these problems. The design day load profile must be as accurate as possible before one proceeds to the next task within our general methodology. The entire biomass DH heating system will be sized off this generated load profile.
The Fuel Bill approach taken by our team will be discussed in more detail in the case study analysis.
Boiler & Storage Sizing Analysis
After the base case has been defined, the next step is to look at different options for boilers and thermal storage.
Biomass boiler and thermal storage sizing
There are several strategies to size the system depending on the characteristics of the site. These strategies are implemented into the tool as follows:
- Minimum buffer vessel size
- Optimum boiler and thermal storage combination
- Limit on the maximum thermal storage size
Minimum buffer vessel size
This option should be chosen when boiler protection needs to be considered. The buffer vessel will contribute to meeting the peak load on star-up so less energy is needed from the auxiliary/back-up boiler. Also, efficiency is increased by the capture of residual heat on boiler shut-down.
Optimum boiler and thermal storage combination
TThe biomass boiler does not need to meet the design peak demand by its own, since this would lead to an oversized boiler which would run inefficiently when the heat demand is low (summer period), therefore, the emissions of the system will increase.
To help the biomass boiler meet the peak demand, an auxiliary boiler and/or thermal storage system may be installed. Different size combinations will be analysed, taking into account that a reduction in the biomass boiler size would mean a greater thermal storage needed if the percentage of energy coming from biomass (rather than from the back-up boiler) is to be maintained.
A back-up boiler that can meet a high percentage of the peak demand should always be considered in case there is a failure in the biomass boiler. This is common practice.
Limit on the maximum thermal storage size
This option is used when space for the potential boiler house and thermal storage is limited.
Biomass boiler types
There are many configurations regarding biomass systems in terms of types of boilers and feeding systems.
Boiler types:
- Stoker burner: simple technology, cheaper than other types of boilers and with a good turndown ratio (TDR) of 4:1 or better.
")
- Underfed stoker: can accept fuel with high moisture contents (up to 50%).
")
- Moving grate: overall the best design for a wood boiler but more complex and expensive.
")
Feeding systems:
- Auger: is the most commonly used feeding mechanism on automatic feeding biomass boilers and it is usually cheaper than hydraulic ram stokers.
- Ram stoker: used on moving grate boilers. It is more reliable than the auger mechanism.
| Advantages | Disadvantages | |
|---|---|---|
Auger feeds |
|
|
Hydraulic feeds |
|
|
Thermal storage types
Once the thermal storage is sized, it can be implemented using one or several vessels. Different numbers of vessels will lead to different thermal losses, costs and operational efficiencies. In addition to the size and number of vessels to be used, vertical and horizontal configurations can be analysed, as well as their location (inside or outside the boiler house).
Vertical vessels are usually used since stratification is taken advantage of. When there is stratification, water inside the vessel is not at the same temperature. Natural convection will lead to hot water to be on the top and cold water on the bottom of the vessel so there is no need to heat the whole vessel to 90 °C, saving energy and heat losses.
Inside or outside configurations will depend on the size of the thermal storage and the space available inside the boiler house.
References:
Carbon Trust, 2013. Biomass
Boiler System Sizing Tool User Manual
Palmer, D. et al., 2011. Biomass
heating : a guide to medium scale wood chip and wood pellet systems
Palmer, D., 2010. Principles
and fundamentals of biomass boiler system design
Fuel Type Analysis
Biomass fuels are typically delivered as wood chips or wood pellets so these are the options that will be analysed within this project. The main characteristics to look at when analysing different biomass fuels are their cost per tonne (including delivery), moisture and ash content, calorific value and density.
Information of specific wood pellets and wood chips has been can be found in the Biomass Energy Centre website.

Main advantages of wood pellets compared to wood chips:
- Wood pellets have a low moisture and ash content while wood chips have more variability in their specifications. Wood chips with moisture contents over 30% can degrade in storage.
- Less fuel storage is needed when using pellets since they have a higher energy density than wood chips. For the same reason, fewer trucks are needed for delivery (meaning less pollution and local disruption).
- Wood chips are harder to handle having a static repulse angle of 90° compared to 45° for wood pellets.
Main advantages of wood chips compared to wood pellets:
- Wood chips are cheaper than pellets.
- Wood pellets may produce a lot of dust during delivery that can lead to an explosion if there is an ignition source.
- Wood pellets may release CO in storage, which is flammable and toxic.
References:
Forestry Commission. (2011). Retrieved February 15, 2014, from National Biofuel Supplier Database Web site.
Pipe Design
Pipe Sizing
Our team approach to pipe design determined that we needed to address the preliminary layouts as a first stage. This was in the basis of most suitable trenching routes and locating the energy centre as closest as possible to our anchor loads. For the following case studies we consider them as ‘probable’ upgrades to the District Heating Scheme so our best Energy Centre location for the first approach would be used as a starting point.
Using the figures from the demand data analysis and the equation shown below we can calculate our necessary mass flow rate that is directly dependent on our supply and return water temperature.
![]() where:
where:
![]() is the power supplied to the district heating system by the energy centre
is the power supplied to the district heating system by the energy centre
![]() is the specific heat capacity of water (extracted from CIBSE C table 4.7 Properties of water)
is the specific heat capacity of water (extracted from CIBSE C table 4.7 Properties of water)
![]() is the mass flow of the water
is the mass flow of the water
![]() is the supply temperature
is the supply temperature
![]() is the return temperature
is the return temperature
Taking into account that the design of the system is a trade-off between pressure and heat losses per metre in the system we needed an iterative process to determine our most suitable pipe diameter. This comes from higher flow rates allowing smaller pipe diameter reducing our heat losses but at the same time increasing the frictional losses and therefore our pumping costs. We decided to establish a maximum velocity of 1.5 m/s and a pressure drop of 350 Pa/m as boundaries for our system. All assumptions have been contrasted against CIBSE guides and diameter calculations have been double checked with a spreadsheet provided with the latest CIBSE C edition and a pipe supplier version to ensure the robustness of the process.
With the previously obtained mass flow rate for the water we would be able to start the iterative process as follows:
- For each of the sections of the system we check different pipe diameters up to the point where the pressure drop increases exponentially and out of our boundaries. We select the previous pipe size.
- For that pipe diameter we calculate the associated heat losses according to the data provided by the supplier that followed the calculation process stated in the CIBSE C Guide.
- Those heat losses for each section are then added to the previous heat demand and therefore constituted our new power requirements that had a most suitable diameter associated.
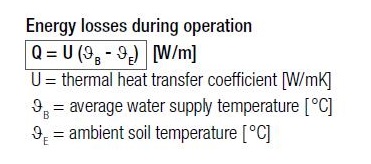
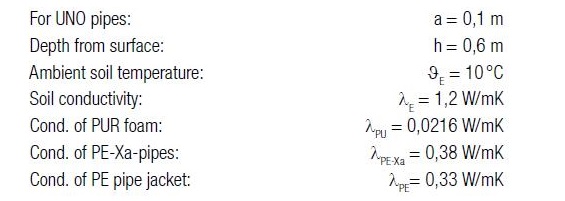
Heat is transferred from the water flowing inside the pipes to the soil leading to energy losses that therefore would imply higher supply requirements to meet the demand. To avoid as much as possible this issue suppliers use different types of insulation. Following the CIBSE Guide recommendations heat losses due to conduction can be calculated according to the equation:
In this project the following assumptions have been made:
To aid us in the process we have developed a spreadsheet that allowed us to analyse different layouts and energy centre locations to determine the most cost-effective solution.
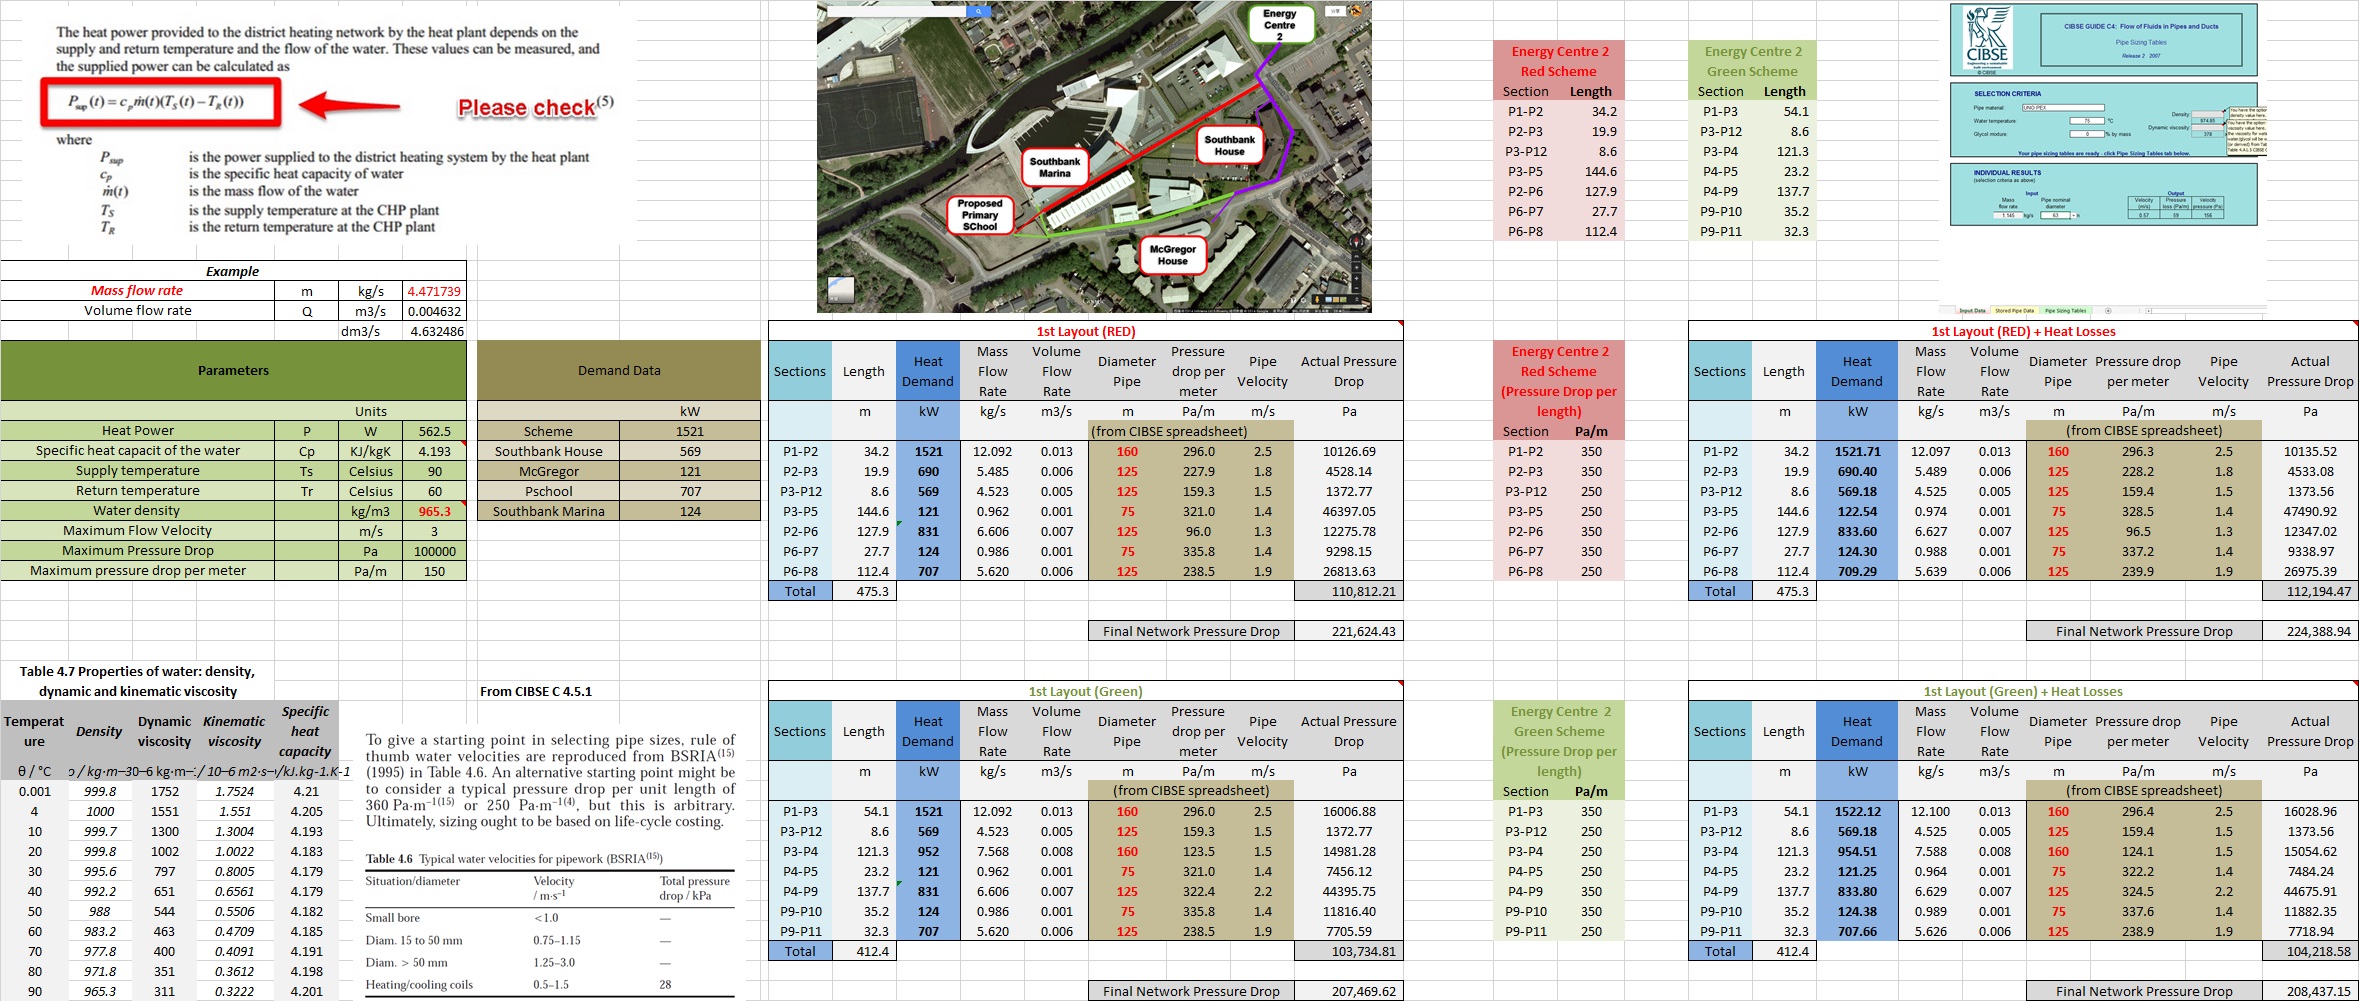
We then need to evaluate, for each of the Energy Centre location, the different piping layouts to be able to determine which one was most likely to have the lower total pressure losses, and therefore we have calculated the associated pumping cost to decide the best option.
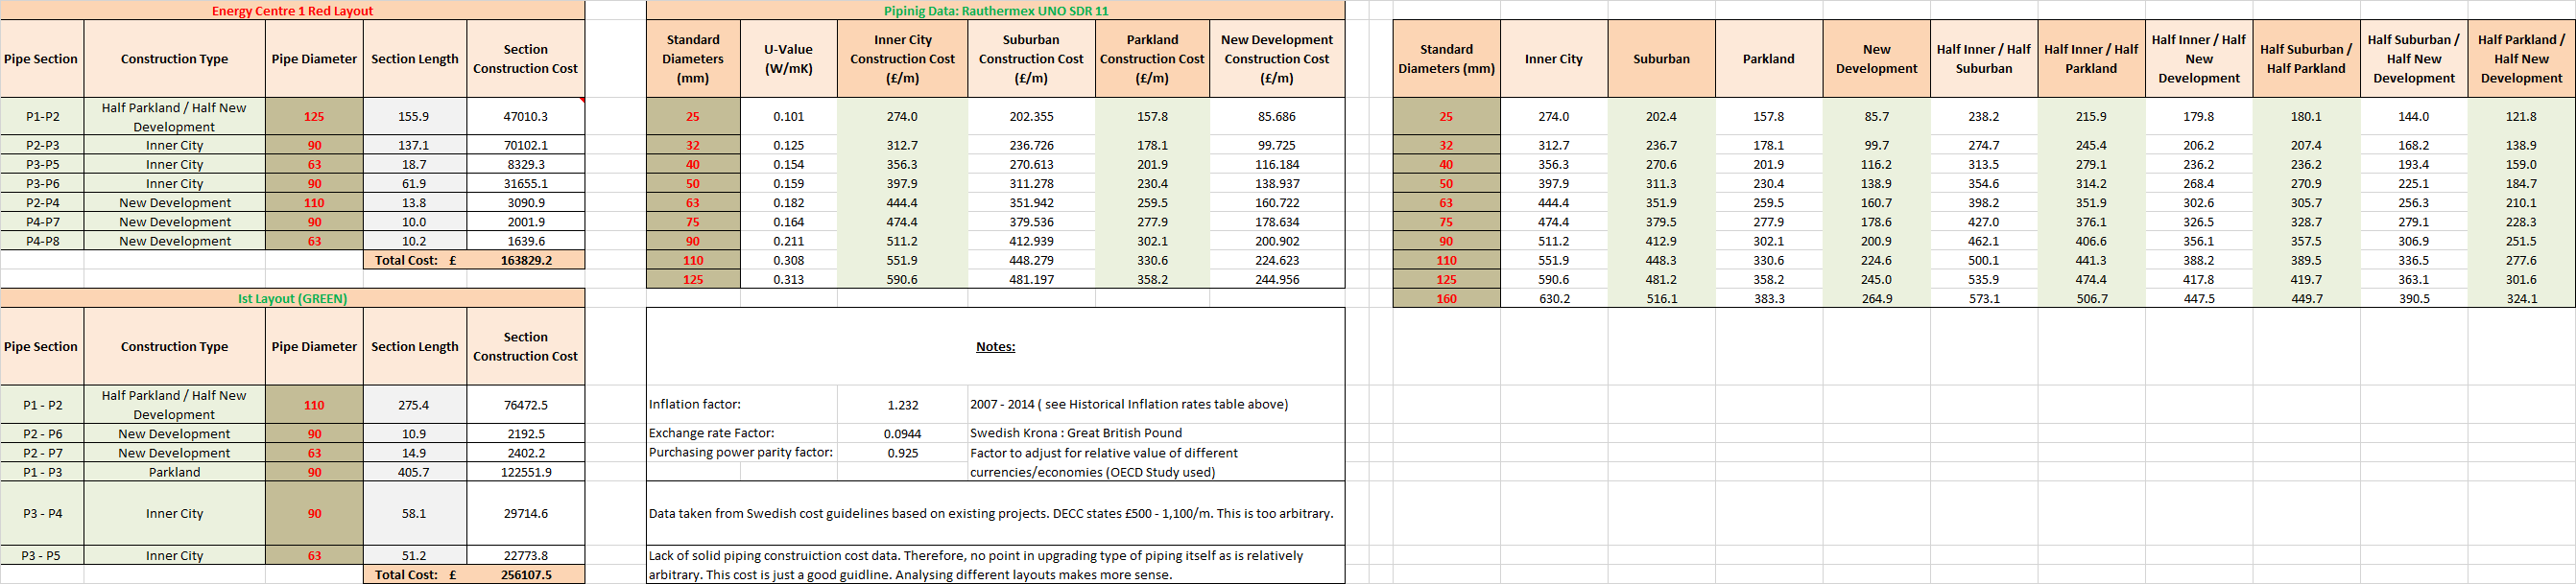
Pipe Cost
As District Heating network is not a mainstream or widespread technology in the UK, hence finding figures for the piping cost section was a difficult task. Concrete data available to the public in order to perform cost estimations was not available. This is one of the many drawbacks to performing a successful and accurate high-level feasibility analysis of DH schemes. For example, the DECC only provides an estimation range from £500-1,100 per meter of piping. Due to the great impact that this cost has on DH project’s financial feasibility, we deemed this estimation to be unacceptable.
Instead, we deemed it more logical to adapted actual Swedish costs from existing projects. We obtained Swedish cost estimations per meter for different land types for which the piping would travel through. Numerous factors were applied to these figures in order to ensure that they could be related to UK based projects. These were as follows;
| Factor | Figure | Justification |
|---|---|---|
Inflation Factor |
1.232 |
|
Currency Exchange Factor |
0.0944 |
|
Purchasing Power |
0.925 |
|
These values where then categorized according to the type of land that needed to be trenched to lay the piping. There are “Inner City”, “Suburban”, “Parkland” and “New Development” construction ordered from the most to the least expensive. Due to some sections of our district heating schemes being likely to be in between those categories we decided to expand our categories to half and half for each of the possible combinations.
References:
Dixon,
T. & Britnell, J., 2012. UK Energy,
Water and Waste Roadmaps to 2050.
Greater
London Authority, 2013. District heating
manual for London. , (1), p.83.
The
Chartered Institution of Building Services Engineers, 2006. CIBSE Guide A Environment
Design.
The
Chartered Institution of Building Services Engineers, 2005. CIBSE Guide B
Heating, ventilating, air conditioning and refrigeration.
The
Chartered Institution of Building Services Engineers, 2007. CIBSE Guide C
Reference data,
The
Chartered Institution of Building Services Engineers, 2012. CIBSE Guide F
Energy efficiency in buildings.
The
Chartered Institution of Building Services Engineers, 2004. CIBSE Guide G
Public health engineering.
Pump Design
Pump Sizing
The index pipe run for each optional layout must be determined. This is a combination of the run with the highest mass flow rate and overall pressure loss. Once the pump can deliver the required mass flow rate to the end of the index run, it can pump to any other point in the system. This index run is a factor of the individual building loads and the pipe distances and design diameters.
For each layout option, the flow, return and additional 20% margin (common practice applied to account for a future drop in system efficiency and bends, tees etc.) is added to determine the total index pressure drop within the piping network operating under maximum load conditions. Using the simple formula H = P / (1000 x g), the pump head (H) required could be calculated.
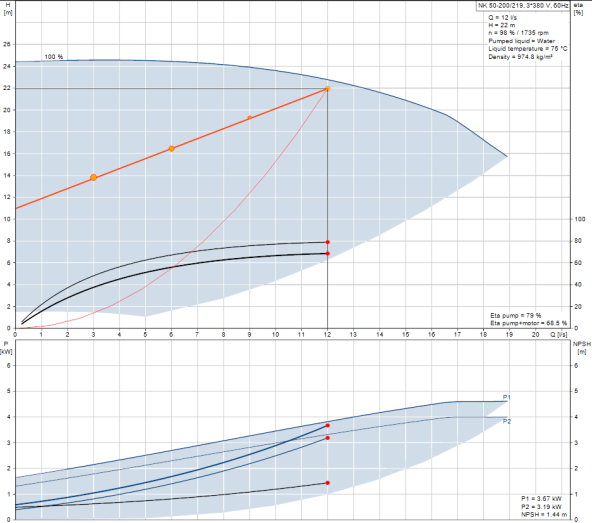
The company, Grundfos, offer a public tool to determine the best pump for any application. This was used throughout the pumping section of the project. The tool requires the pump head and mass flow rate under design day conditions. Other input data such as fluid operating temperature and electrical power input can be input into their tool to select the best pump option, with regards operation and capital and operational costs. Variable speed drive pumps are important as the load variation throughout the year in the DH network will be considerable. A screen-shot from the pumping tool may be viewed below;
")
")
Once the pump has been selected, capital and annual operational costs may be determined.
Pump Costs
For each piping layout option and corresponding pump selection, capital and running costs may be determined using data from both the Carbon Trust and Grundfos tools.
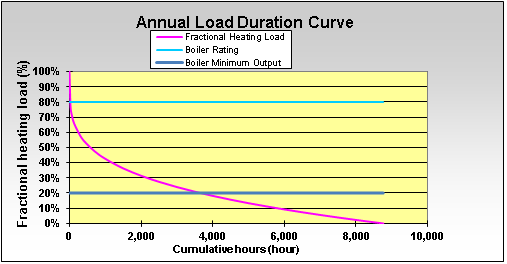
From the Carbon Trust tool, the total annual operational hours of the DH distribution network at different percentages of the maximum peak load could be determined. The corresponding mass flow rate in the piping network could also be calculated using the mass flow rate at each operating point throughout the year. The Grundfos pump curves and catalogue data could be used to verify the pump efficiency and rated power outputs. Using this data, the annual running cost of the pumps may be calculated. An example of two of the graphs providing some of the critical information from both tools to determine pump running costs is seen below:
The capital cost of the pump sets is easily found using manufacturers catalogues. All pumps should be twin pump sets. This is common practice in the industry. 100% duty stand-by is important, as the whole DH scheme should not shut down for pump maintenance or repairs. It is clear from this process that the boiler house location has a large bearing on the annual running costs of the DH pumps.
Best Piping Network
The main criteria to determine which layout is the most suitable would take into account the piping and pumping cost, as well as the room for upgrading and expansion that it could have. This last point takes into account possible anchor loads close to the first scheme and the easiness of connection.
Financial and Environmental Analysis
Financial results
In order to analyse the financial feasibility of the DH network, the total capital cost, cost savings and payback period for every option will be calculated. Values for discount rate and inflation rate have been considered at 8% and 2% respectively, according to the Scottish Government recommendations.
At this point it is important to take into account the Renewable Heat Incentive (RHI) or any available capital grant, noticing that they are mutually exclusive depending on the source of the money. In addition, there will be savings from the Carbon Reduction Commitment with a value of 16 ₤/tonne CO2 saved.
Finally, a sensitivity analysis will be carried out changing the parameters that have more uncertainty and may have more impact on the final results:
- Fuel inflation rate
- Piping capital cost
References:
The Scottish Government. (2014, April 22). Retrieved April 22, 2014, from The Scottish Government Web site.
Energy results
Energy savings between the different options and the base case will be calculated and discussed on a scheme by scheme basis.
Environmental results
From an environmental point of view, the result that is more relevant and therefore will be compared between the base case and the new system is the savings in CO2 emissions.
DEFRA Analysis
According to the Clean Air Act UK and due to our District Heating schemes being powered by a biomass boiler system we have had to assess the associated emissions and the effect they have on the air quality of our area of study. This is due to the fact that our systems power output is lower than 20 MWth. In such cases, the regulator will enforce local authority. We have assumed that dust emissions (particulate matter) that could occur when emptying the ash containers on the boiler shall be minimised. In order to ensure that no fugitive dust emissions would occur, the emptying operation must be carried out inside the energy centre with ash containers being emptied into waste sacks which are tied at the top. Nevertheless, dust (particulate or PM) and nitrogen oxides (NOx) emissions will result from the operation of the biomass boiler. These emissions would add up to the existing dust and NOx concentration levels and therefore there is a need to assess the potential impact of our schemes operation. Following the Environmental Protection UK (EPUK) guidelines we have developed the subsequent tasks:
- Firstly, we need to obtain the average annual background concentration levels of pollutants. Maps are provided as tools by the Local Air Quality Management section of the Department for Environment Food and Rural Affairs (DEFRA). These maps are for sections of 1 km x 1 km.
- For each of the pollutants, dust and NOx, we have to calculate their contribution to the annual mean. To do this we need to know:
- The flues stack height for our energy centre and the height of the surrounding buildings (according to the Clean Air Act we need to consider those within a range of five times the stack height). We have assumed that at least the flue chimney has to be 1 m higher than the highest of the surrounding buildings.
- Technical test data from suppliers for the different biomass boiler sizes, namely NOx and particulate in g/GJ and their thermal efficiency at nominal heat output. This data needed to be introduced into the EPUK Screening Tool to obtain the values that would be accumulated to the background levels.
- Finally, we added up the contribution to the annual mean and the background concentrations to compare against the maximum limits allowed in the Air Quality Standards. In this particular case the annual mean values for Scotland are 40 µg/m3 for both pollutants (see table below).
")
Weighting and Options Ranking
After the financial and environmental analysis, an option ranking must be built in order to choose one configuration and make recommendations.
Weighting process
Not all results previously calculated have the same importance and thus weighting factors have been defined as follows:
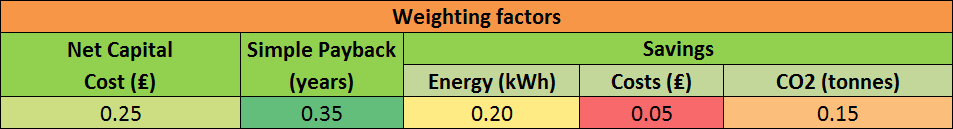
These values are subjective and so they can be changed depending on what is believed to be more significant. In this project more importance has been given to financial parameters since costs will finally determine if the project can go forward. For example, there may be an option that saves more CO2 emissions than another, but if finally, the cost of the first option compared to the other one is too high, the decision will fall to the side of financial parameters rather than the environmental. However, the environmental part is considered important as well.
Once, the weighting factors have been set up, the options ranking can be developed as follows:
- Results for all options must be expressed as a percentage so that no units are involved. This may be done by comparing the different values against the worst one case.
- Three intervals of performance have been defined: good, medium and bad.
- Values for each interval of performance are assigned to all options:
Good - Value: 3
Medium - Value: 2
Bad - Value: 1 - Finally, these values are multiplied by the weighting factors above and added together for each option, giving a ranking.
An example of this process is illustrated in another page.
Site Recommendations
The weighting and options ranking process gives the information needed to make the decision on which configuration is more appropriate. Results have to be interpreted since several options may have the maximum value in the ranking, and in that case, decision should be based on an understanding of the system and the advantages and disadvantages of the each option.
Next Site
This is the final step in our methodology. Here, additional buildings may be selected to potentially extend the DH scheme. Otherwise, a whole new site/location may be selected to perform a biomass DH feasibility analysis. The methodology and accompanying design tools and descriptions/examples of how to use them may be adapted to either option. This deliverable was one of the main objectives of our project.
At this point, how to adapt the methodology to any carefully selected group of buildings has been explained in detail. As a group, we have applied these processes to a case study, presented to us by the East Dunbartonshire Council, Scotland. Applying the methodology to a realistic case study is critical in not only scrutinising the methodology and design tools, but also in drawing invaluable results, recommendation and conclusions regarding biomass DH and its feasibility within the UK.