
RESULTS
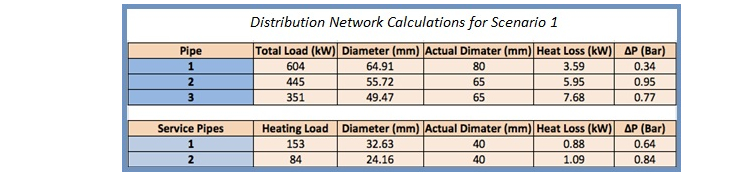
The key results for both distribution networks are summarized in Tables 1 and 2. The peak heating loads are shown from which the pipe diameters have been calculated for each section of the network. From this an appropriate pipe size has been chosen based on the pipe dimensions that are available. Additionally, the corresponding heat loss and pressure drop calculations are summarized in the final two columns.
KEY RESULTS
For scenario one the total heat loss is 35kW, which corresponds to 6.2% of the total peak-heating load. Also, the largest pressure drop for a continuous run of piping is 2.13 bar. From this the pumping pressure required can be calculated.
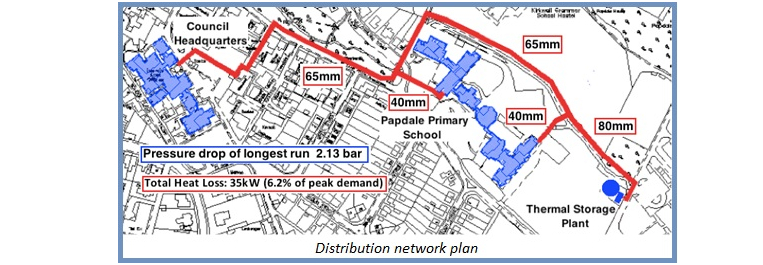
The figure below gives a plan view of where our calculated pipe diameters relate to the distribution network for scenario 1. The initial pipe has the largest diameter of 80mm since it is designed to carry the entire heating load, while the service pipes to each building are much smaller at 40mm.

RESULTS
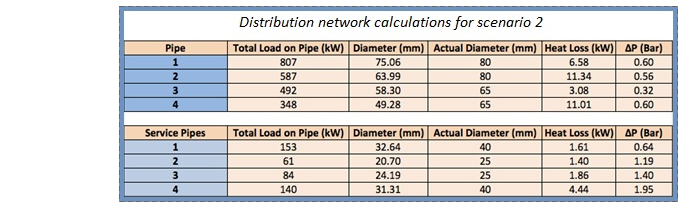
A summary of the results from the calcualtions for the second scenario can be seen in the table below. The second scenario is characterised by a larger heating load than that of the first scenario. Consequently, it is expected that the pipe dimensions will be larger because of a increased mass flow rate. This is illustrated in the table below.
KEY RESULTS
For the second scenario the total heat loss is 41.3kW, which corresponds to 5.4% of the total peak-heating load. And finally, the largest pressure drop for a continuous run of piping is found to be 3.44 bar.