


ESP-r Model
Our Model is based on the case study of Clydeview academy, this allowed us to use construction materials and dimensions which are true and therefore make our results realistic. We constructed three models to various standards: Victorian, Intermediate (2006 L) Standards, and Advanced (Clydeview Academy) Standards. Our initial simulations proved that because of the poor U-values of the Victorian construction, overheating would not occur. The Intermediate and Advanced were therefore developed more fully.
Model Construction
Instead of modelling a complete school we focused in on adjacent classrooms with a corridor in between (see Figure 1). Each classroom was 8.6 m wide and had a depth of 7 m for a floor area of 60.2 m2, with a ceiling height of 3.3 m, with a total volume of 198.66 m3. The corridor was 3 m deep and also had a height 3.3 m. The dimensions of the glazing are 5 m wide by 2 m high. This was simplified for the purpose of modelling to one glazed area instead of the two separate windows in the architect’s drawings.The classrooms were orientated to face east/west again mimicking the case study of Clydeview academy. However as part of our sensitivity analysis, we have orientated our building to face north/south to investigate the impacts on overheating. This can be found in the sensitivity analysis section of the website.
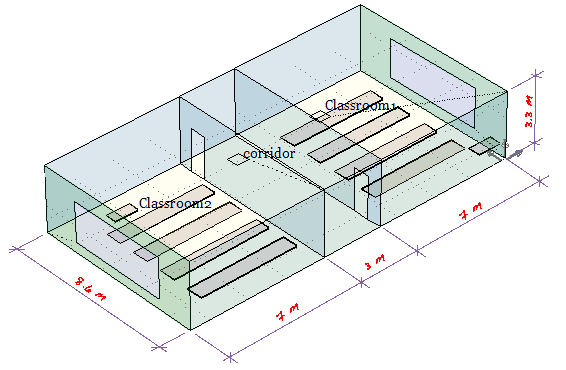
Figure 1: Our ESP-r Model
The construction materials and U-values used in ESP-r were set as close to the actual materials used in the construction of Clydeview academy. The construction materials used and their corresponding U-value can be seen below in Table 1.
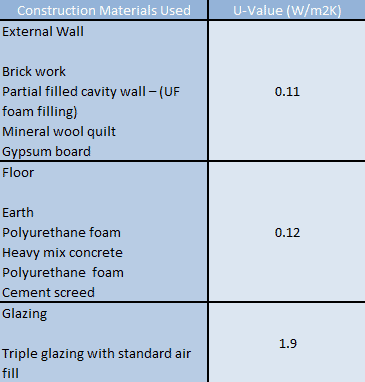
Table 1: Advanced Model U-Values
Additionally, thermal mass has been added to the model in the form of furniture. This was done, as desks would have an impact on the maximum internal temperature experienced the classroom. Thermal bridges were also added as these have an impact on the heat released to the external environment.
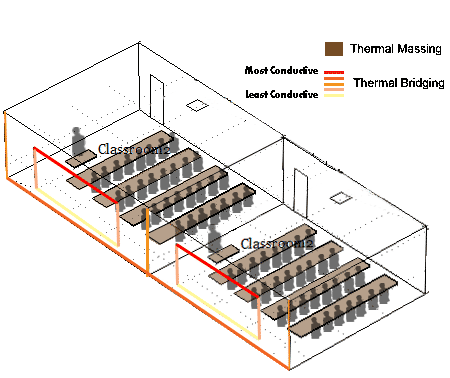
Figure 2: Thermal Bridging and Thermal Massing in Model
Assumptions
To operate the model effectively so as to mimic a modern classroom environment, a number of assumptions had to be made. These are generally related to operation and controls, and were made on recommendations from different technical standards and case studies.
- 31 Students, 1 Teacher
- Hours of Occupation: 9 am- 4 pm
- Heating Set Point: 19ºC ±2ºC using a PID controller only operating in winter months (i.e. heating is turned off in summer months as per instructions from Building Bulletin 101)
- Windows Open for Natural Ventilation at 25ºC, as per CIBSE Guide A. An air flow network was set up to match the Natural Ventilation strategy. The ventilation strategy consisted of window openings of 400 mm and 100 mm located at high and low level openings respectively, combined with a 600 x 300 mm stack which terminates at roof level with a cowl. This provides a cross-flow ventilation strategy and matches Clydeview Academy’s ventilation strategy.
- During the summer period a night time purge also takes place between the hours of 12 midnight and 5 am and is limited to 0.3 ac/h as stipulated in environmental room data sheet
- Lighting is operational from 6 am - 10 pm, with a casual gain of 5.4 W/m2 as per specifications from the architect’s documents. To lower energy usage and heat gain, a lux sensor set at 400 lux (from CIBSE Guide A) is included to automatically regulate lighting if sufficient natural light is provided
- Gains From ICT:
- 60 Watts for today's computers (from our monitoring)
- 25 Watts for future computers (from our trend study)
- 5 Watts for tablets (from our monitoring)
Inter-Model Comparison
Both of the following models are static. We simulated our ESP-r model statically to compare with our case study's engineer's model, then added an air flow network to simulate our results.
Professional School Model
In an effort to ensure that our model was giving correct results, we undertook an inter-model comparison with a similar model which had been undertaken by the engineering firm Ramboll™ during the design stage of Clydeview academy. The simulation period undertaken by Ramboll™ was only for the key summer overheating period (1 May – 30 September), unlike the rest of the models undertaken within this website which focus on the whole school term. The ventilation strategy applied to this model was so to provide 8 l/s/person. For the purpose of comparison we have used the same static approach. However, for all other modelling within the website, we have implemented an air flow network to better represent the natural ventilation that would be achieved in the classroom.
Although the models’ areas, volumes and constructions should be the same, we expected the results to be different because not only was different modelling software, but also different climate files, and the like. The results of the model comparison can be seen in Table 2.
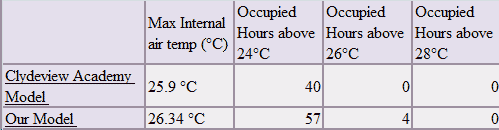
Table 2: Intermodel Comparison
As can be seen from Table 2, our model comparison shows that the hours of overheating are similar with the maximum internal temperature only, differing by approximately 0.4°C. Our model has 17 more hours above 24°C and 4 more hours above 26°C. However this can be easily explained by the fact that the modelling software and climate files used for each of the models were different, therefore proves that our models are definitely comparable in terms of overheating.