
- General Considerations
- Specific Considerations

Wind – Assessing Potential within the Rural Area
This technology will depend on the weather, producing power proportionally to the instant wind speed. As well as the wind speed, the wind direction will also be important for the positioning of the wind turbine in order to generate electricity. The susceptibility of this technology to variations, generated by natural conditions, makes it to be a non-constant supply that requires several assumptions.
Power produced
The power to be produced by a wind turbine will be a function of the swept area of the rotor, air density, wind speed as well as the Coefficient of Performance (Cp).
P: Power (W)
Cp: Coefficient of performance
R: Air density (kg/m3)
A: Swept area of rotor blades (m2)
V3: Wind speed (m/s)
The Cp is a characteristic of the turbine and the relation between the tip speed of the blade and the pitch angle. This value will be limited by the Betz limit to 0.593; having, in practice, values of up to 0.45 in modern wind farms and typical values of around 0.3 in commercial wind turbines. As this value is related to the tip speed of the blade, it will vary according to the rotation speed of the blades.
The air density will vary according to the altitude and temperature; having values according to the following tables (Table 1 & Table 2) - being able to extrapolate or interpolate values in the case of different temperatures or altitudes:
Table 1. Air density as a function of annual mean temperature.
| Air temperature (°C) | -8 |
-4 |
0 |
4 |
8 |
12 |
16 |
20 |
24 |
28 |
32 |
34 |
36 |
Air density (kg/m3) |
1.33 |
1.31 |
1.29 |
1.27 |
1.26 |
1.24 |
1.22 |
1.20 |
1.19 |
1.17 |
1.16 |
1.14 |
1.13 |
Source: Stankovic et al, 2009
Table 2. Air density as a function of height above sea level.
| Height (metres over sea level) |
0 |
100 |
200 |
300 |
400 |
600 |
800 |
1000 |
1500 |
2000 |
Air pressure |
101.3 |
100.1 |
98.9 |
97.7 |
96.6 |
94.3 |
92.1 |
89.9 |
84.4 |
79.9 |
Air Temperature |
288.1 |
287.5 |
286.8 |
286.2 |
285.5 |
284.2 |
282.9 |
281.6 |
278.4 |
275.1 |
Air density |
1.22 |
1.21 |
1.20 |
1.19 |
1.17 |
1.15 |
1.13 |
1.11 |
1.06 |
1.01 |
Source: Stankovic et al, 2009
* For estimation purposes the air density value usually considered is 1.22 kg/m3, assuming sea level and a temperature of 15°C.
Wind speed
There will be three important wind speed values in wind turbine design:
Cut-in speed: The speed at which the turbine will start to generate power.
Rated speed: The speed at which the turbine will produce its rated power.
Cut-out speed: The maximum wind speed at which the turbine can operate.
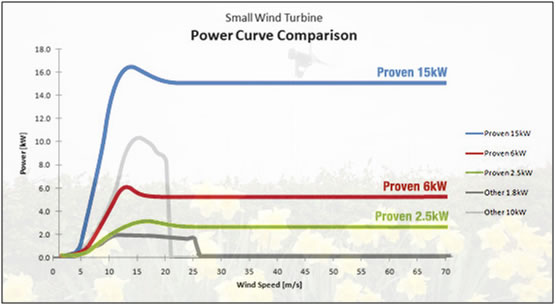
A normal turbine will start working at the cut-in speed and will increase its power generation until it reaches the rated speed and from there onwards the power generation will remain constant until the cut out speed is reached. In some cases for small scale wind turbines, the turbine will be turned off when the cut-off speed is reached, while in other cases, the rotor will continue working by including safety features to reduce the damage that may be caused by the higher speeds. In order to keep the electricity supply at a defined frequency, the rotation speed of the generation will be controlled.
Graph 1. Typical power curves of turbines of different sizes.
Source: Proven Energy (http://www.provenenergy.co.uk/windturbines_why_comparison.php)
The wind speed will be the main variable for power production. The instrument used for measuring wind speed is the anemometer. For reading the wind direction, a wind vane is used. The wind speed data will usually be given at a reference height (typically 10 metres) that may be different to the height we are interested in. For estimating the wind speed at a different height there will be several formulas involving several considerations. As a common method, the Power Law is used for defining vertical wind profiles.
Where:
V : Wind speed at the new height (m/s) (extrapolated speed).
Vo: Wind speed at a reference height (m/s) (measured
speed).
H : New hub height (m) (extrapolated height).
HO: Reference height in (m) (measured height)
: Empirical wind shear exponent
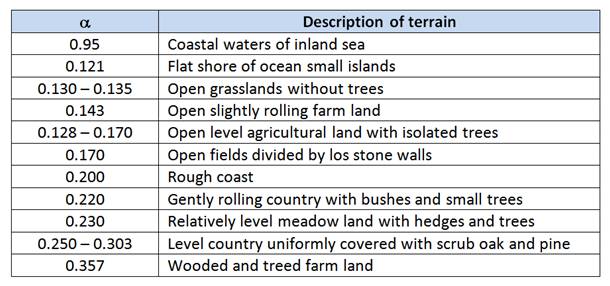
The value of a is an empirical value that will depend on the roughness of the terrain, the highest being the roughest. In table 3, some values are presented according to Davenport (1960).
Table 3. Influence of surface roughness on œ for Power Law
Source: A.G. Davenport, 1960
Wind speed distribution
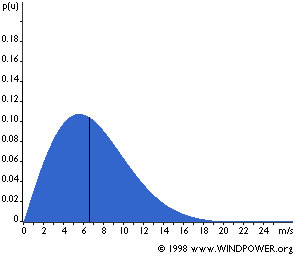
The variations in wind speed will need an analysis of its distribution through time in order to know the supply and therefore the power yield. The distribution of wind speed values during the year will adjust to the Weibull distribution probability curve (Graph 2); from where the velocity exceedence curve (Graph 3) can be generated. With this curve it may be possible to know for how many days we will have a certain wind speed and, therefore, how much power can be produced.
Graph 2. Weibull distribution curve
Graph 3. Velocity Exceedence Curve
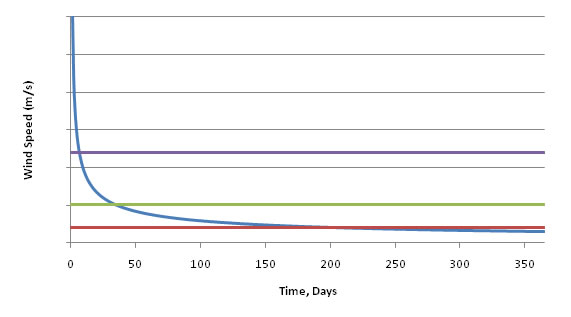
When obtaining wind data, if you do not count with historic local data measured on site (preferably around 10 years), it may be possible to find the average wind speed for your area given by the Department of Trade and Industry (http://www.bwea.com/noabl/index.html). The value obtained here will be the average value which then can be processed assuming the Weibull distribution theory. For this it will always be necessary to obtain readings over a long period of time (between 4 month and 1 year) in order to make the necessary adjustments to the parameters of this theory.
Location
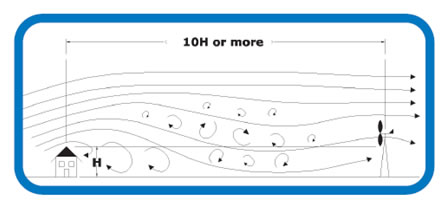
As the wind speed will be erratic, variations will also be found related to the presence of obstacles in the area. Trees, building, hills or even crops will influence wind speed and produce turbulence. The existence of turbulence will reduce the efficiency of the wind turbine as it will represent continuous changes in wind speed and direction. The further the wind turbine is from any obstacle, the better. In Figure 1, a recommendation made by the Energy Savings Trust for the location of a wind turbine is shown; the height H can represent either a building or tree.
Figure 1. Possible location of a wind turbine clear of obstacles
Source: Energy Savings Trust, 2004As the location has a direct impact on the wind characteristics and hence, annual power yield, it will have an impact on the Capacity Factor of the system as well. The capacity factor is the total power produced in a year divided by the power that would be produced by generating all the year at its rated power. In the case of small scale systems, values in the range of 0.29 and 0.17, with an average of 0.04 (Warwick Trials Report, 2008), are expected; showing that the installation of small wind turbines requires much more care when planning.
Environmental
The environmental concerns regarding wind turbine technology are less than those for conventional power production. That taken into account, there will always be several issues to consider when planning the installation of a wind turbine. The possible environmental impacts to consider when planning the installation of a wind turbine will be:
- Visual impact: the way in which the installation of a wind turbine will impact on the landscape and how the surrounding area will be affected with this.
- Noise impact: The rotation of the rotor will produce noise that can affect people and wild life. This issue becomes more relevant with small scale renewables, as they are closer to the ground and rotate faster than large turbines.
- Radial interference: The presence of a structure that works with electromagnetic equipment may affect radial communications.
- Birds: Some consider the movement of the rotor represent a hazard for flying animals as they may be killed.
- Shadow Flicker: As a rare impact, the shadow of the moving rotor may generate a flickering effect that may affect some people.
Costs
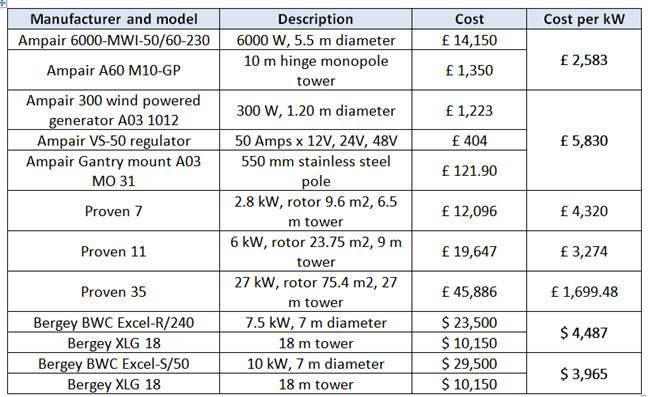
The installation of a wind turbine will vary according to the installation conditions and specific needs; being influenced by factors such as access, tower height and the work required for electrical installation. In general, the larger the turbine the lower the cost per installation of rated power. As a guidance, in the following table (table 4) there can be found the costs of some turbine models.
.
Table 4. Some common wind turbines and costs.
Sources: Proven (http://www.provenenergy.co.uk/)
Ampair (http://www.boost-energy.com/ampair/default.asp)
Bergey (http://www.bergey.com/)* Random costs extracted from the indicated web pages for reference only.
References
- ATTRA (2007), “Small-Scale Wind Energy on the Farm”
- David Spera (1994), “Wind Turbine Technology: Fundamental Concepts of Wind Turbine Engineering”
- Devenport A.G. (1960), “Rationale for determining Design Wind Velocities”, American Society of Civil Engineers
- Encraft (2009), “Final Report from Warwick Wind Trials Project”
- Energy Savings Trust (2004), “Energy Efficiency Best Practice in Housing; Installing small Wind-Powered electricity generating systems”,
- Practical Action, “Energy from Wind – Technical Brief”
- Sinisa Stankovic, Neil Campbell, Alan Harries (2009), “Urban Wind Energy”
| MSc: Renewable Energy Systems and the Environment | © University of Strathclyde 2010 |