Energy Recovered
By obtaining polynomials of the power curves produced from the rotor assessment results, the annual energy recovery of a farm of 24 turbines could be evaluated and compared.
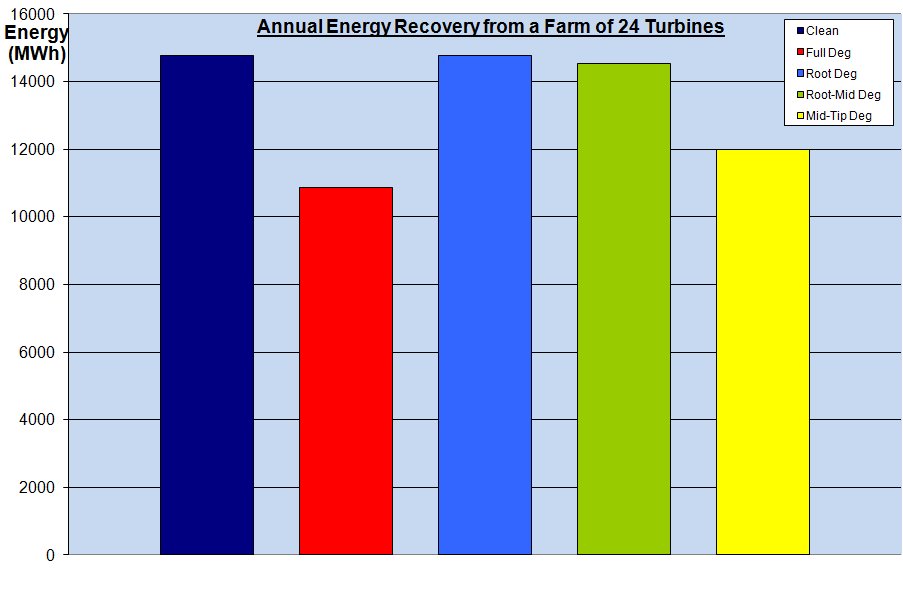
The above figure displays the annual energy recovery in MWh for the levels of surface degradation analysed during the initial rotor assessment. For each case, 3% of the energy extracted was deducted from these values to account for downtime for maintenance. As expected, a similar pattern to that of the rotor assessment was observed. The annual energy recovery decreased when the rotor became increasingly degraded towards the outer regions of the blades. The poorest return was observed when the rotor became fully degraded across the entire span of the blades. Tabulated results for this graph are displayed in the Table below.
Farm
(24 Turbines) |
Energy Per Tidal Cycle (MWh) |
Energy Per Year
(MWh) |
Clean |
613.5835673 |
14769.80818 |
Full Deg |
451.4382168 |
10866.74452 |
Root Deg |
613.2305653 |
14761.31093 |
Root-Mid Deg |
604.1559498 |
14542.87234 |
Mid-Tip Deg |
498.6521786 |
12003.25012 |