Small Scale Hydro: Novel Approaches to Generation & Transmission

Generation Results
This section of the website offers discussion on some of the key results obtained during the analysis. Comprehensive PDF screenshots of all the analysis can be downloaded at the foot of the page. The aim of the analysis was to use the tool to iteratively optimise turbine and pipe configurations for the given flow characteristics of each corrie obtained from LowFlows. The tool provides the scope to compare the optimal energy capture obtainable from a given flow and the optimal economic return. As such, analysis was carried out for various site/flow/turbine configurations in order to evaluate the energy yield of such schemes and their 20 year financial performance.
We initially analysed the individual performance of the Henzie, Coinnich and Chultrain from the perspective of them each being exclusively developed in the Glen. This was to ascertain whether the results obtained from the Excel tool were in accordance with the indicative turbine/pipeline sizes received from contractors and manufacturers. This initial stage of analysis neglected the estimated power line upgrade and only took into account smaller grid connection costs. A sensitivity analysis was carried out in order to ascertain the parameters that yielded the optimum financial return after the 20 year feed in tariff period.
Downsizing of Individual Systems
The initial aim of this area of investigation was to ascertain, when solely considering in individual system, what corrie would give the greatest return over 20 years and would that return be maximised through limiting the turbine size? The analysis was implemented using flow data for Chultrain, Henzie and Coinnich.
The site characteristics used in the analysis of Chultrain are shown in Figure 1.
The intake elevation, turbine elevation and pipe lengths are all values that have been estimated from site visits and discussion with contractors on the probable layouts of the proposed schemes. The turbine efficiency of 80% was chosen to reflect the performance of pelton/turgo turbines currently available in the market. The roughness coefficient of 0.003mm is chosen to be representative of PVC pipelines.
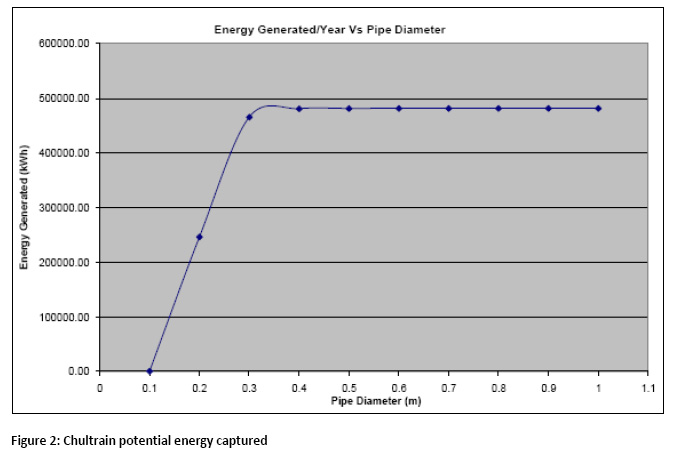
Monthly flow duration data is then added to the calculator along with potential turbine ratings. Initially, a 100kW turbine rating is used. The potential energy captured for these specifications over a range of pipe diameters is given in Figure 2.
It can be seen from Figure 2 that the amount of energy that can be potentially captured from the scheme maximises at a certain pipe diameter. This is because at smaller pipe diameters, the head loss due to friction is limits the amount of kinetic energy that the water generate. As the pipe diameter is increased, the head loss due to friction becomes less dominant on the potential power, and the limiting factor then becomes the rated power of the turbine and the availability of sufficient flow rates.
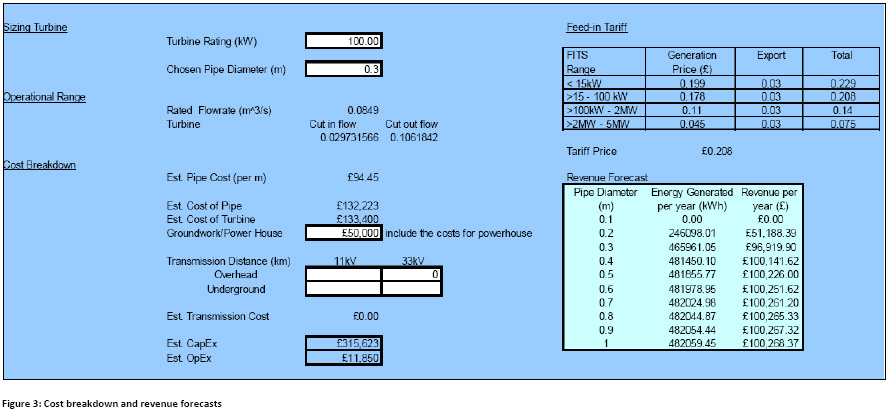
For this particular configuration, a pipe diameter of 0.3m is considered suitable to optimise energy capture, hence the costs involved in the potential scheme are calculated from this value, and are shown in Figure 3.
As previously mentioned, initially any transmission costs were neglected from the calculations. This is done to ascertain the financial potential of a scheme without any skewing of results from exorbitant transmission costs. The groundwork/power house costs are estimated in accordance with the size of turbine and generation.
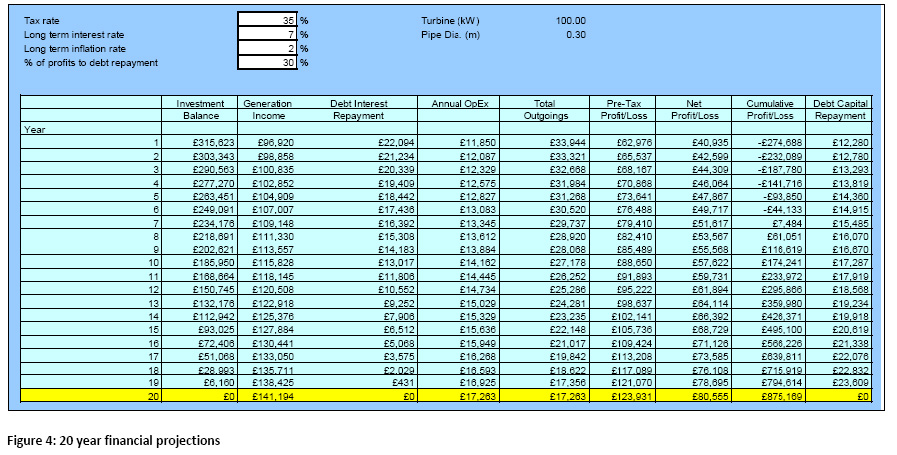
This is then integrated into a financial projection (Figure 4) over the 20 year lifetime of FITs. The interest and tax rates are estimated at April 2010 values. A 20 year payback is used for each scheme as a way of standardising the economic performance. This is done by varying the percentage of profits used to repay debt. The final value of interest is therefore the cumulative profit/loss of each scheme over 20 years.
Figure 4 shows that for the potential single scheme at Chultrain, with a 100kW turbine one could look to gain a £957,169 profit after 20 years.
The same method was used to carry out analysis over 3 varied turbine ratings and the results are summarised in Table 1
The results in Table 1 indicate that it is financially advisable to restrict the power rating of an individual scheme to 100kW as one would receive a much larger financial return. This is due to the 100kW rated turbine being on a higher FIT rate.
Similar analysis is carried out over for Henzie and Coinnich corries. For the 2 corries monthly flow data was input into the calculator along with turbine sizes recommended by a manufacturer (231kW and 75kW for Henzie and Coinnich respectfully). The results for these recommended turbine sizes were then compared to turbine sizes that would maximise financial return. The results are similar to those calculated for Chultrain in that, if only a scheme was to be constructed in the glen, there would potentially be greater financial rewards by downsizing the turbine. The results for this analysis are summarised in Table 2.
From the 3 corries, if one was to consider an individual system and neglected transmission costs, the highest return after 20 years comes from a 100kW scheme taking advantage of the Henzie flow. Even though the 231kW turbine has the potential to capture a greater amount of energy throughout the year, the 100kW outperforms it financially. In addition, the 100kW is also advisable as it will operate at its maximum rating for longer periods throughout the year, producing a more consistent level of power annually.
Integrating Transmission Costs
As Henzie is calculated as the most financially viable of the 3 individual systems, the analysis then looked at the impact of integrating the cost of transmission into the 20 year financial forecast.
Similar to the previous analysis, the site and flow duration data is entered into the calculator. The characteristics of the Henzie site are shown in Figure 5:
There are two potential transmission routes that could theoretically be constructed to transmit the power from the Glen - either 11km of 11kV line or 6km of 33kV line. For full technical and economic discussion on these please read the Transmission section of the website. The cost of the 11km, 11kV line is estimated as £580,000 and the 6km, 33kV line is estimated as £560,000. These figures are then integrated into the financial analysis which is summarised for the two cases in Table 3.
The results in Table 3 indicates the substantial influence the transmission costs have on the 20 year profit/loss as the forecasted profit falls by £850,000 when transmission is included.
Common Pressure Header
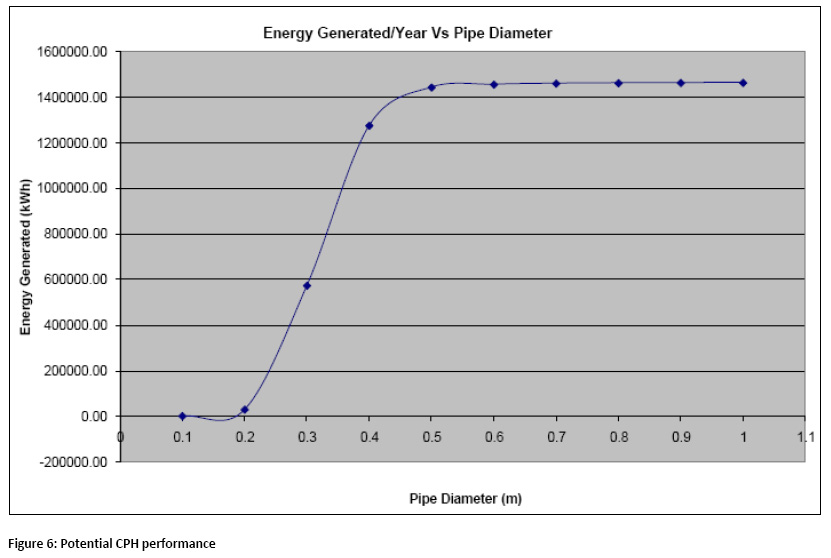
In this part of the analysis, the group wanted to identify weather it is more economically viable to combine the 3 flows into a common pressure header with large turbine or to have 3 smaller individual turbines, all generating separately but collectively contributing to the power generated by the glen as a whole and hence on the lower 14p/kWh FIT band. The monthly flow duration data for each corrie was summed together to represent the available flow rate should all 3 be connected in a common pressure header. By iteratively changing the turbine size in the calculator to optimise the amount of energy captured from the flow, a suitable turbine size for a common pressure header was found to be 570kW. The potential energy captured from such a scheme is shown in Figure 6.
Each a turbine for each individual system was then iteratively optimised and financial data recorded. The economic performance of the smaller optimised systems could then be compared to a larger CPH system over a 20 year period. The results of that analysis are shown in Table 4.
The results of this section of the analysis are indicative that 3 smaller turbines are more preferable to a common pressure header in both energy capture and financial return. Although the initial capital expenditure of the 3 turbine system is higher, the collective operational costs are less and therefore over the 20 year FIT lifespan a 3 turbine system has a greater return.
The collective energy captured by 3 smaller turbines is also greater than 1 larger common pressure header system. This is because a larger turbine requires a substantial flow to be available in order to generate power, which means it cannot take advantage of the smaller seasonal flows. As the smaller turbines only require smaller flow rates, they can take advantage both of the large winter and smaller spring/summer flows. In turn, this system captures around 20% more energy than a common pressure header throughout the course of a year.
To read the collective conclusions on both generation and transmission click here.
Comprehensive results download:
Chultrain:
Results without transmission costs - 90kW, 100kW, 110kW
Results (100kW turbine) with transmission - 11km 11kV, 6km 33kV
Henzie:
Results without transmission costs - 100kW, 231kW, 250kW
Results (100kW turbine) with transmission - 11km 11kV, 6km 33kV
Coinnich:
Results without transmission - 75kW, 100kW, 110kW
CPH:
Common pressure header - 570kW


