SIHEEBEP
Study of the Impact of Home Entertainment Equipment on Building Energy Performance
ESP-r
The following simulations and the model described in the Model section have been developed with ESP-r. ESP-r (Environmental Systems Performance – research) is an integrated modelling tool for the simulation of energy performance of buildings. The system is capable of modelling heat, air, moisture and electrical power flows to user specifications.
The tool has been developed and upgraded in the Energy Systems Research Unit (ESRU) of the University of Strathclyde and has been satisfactorily serving researchers for more than 30 years.
ESP-r comprises of a central Project Manager, which is connected to a collection of databases, a simulator, different performance assessment tools and other applications for CAD, report generation and visualisation, in addition to this, a results analysis interface provides many different views of simulation results to make performance appraisals.Simulations procedure
Different simulations were carried out in order to analyze the energy performance of the dwelling under analysis in the three situations previously described in the Energy Demand Profiles section.
The three models of the dwelling, one per each situation as shown in the Casual Gains section, were simulated in two different seasons:
- Winter
- Summer
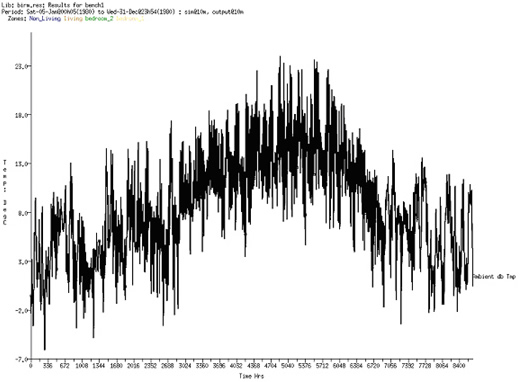
The climate data for the simulations was the Typical Meteorological Year of Dundee, Scotland. The ambient temperature for this location all throughout the year is shown in picture below:
Figure 1. Dundee ambient temperatureAs different demand profiles were assumed for week and weekend days, the models were simulated for one whole week in each season.
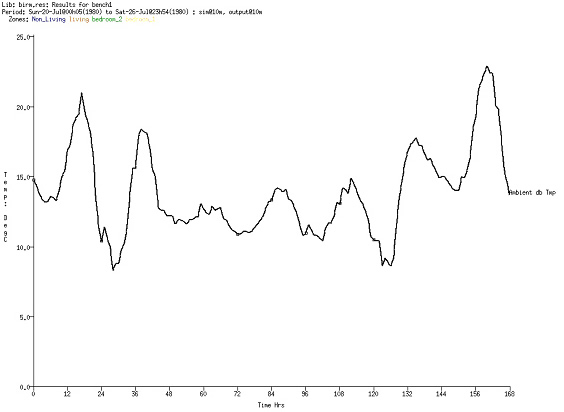
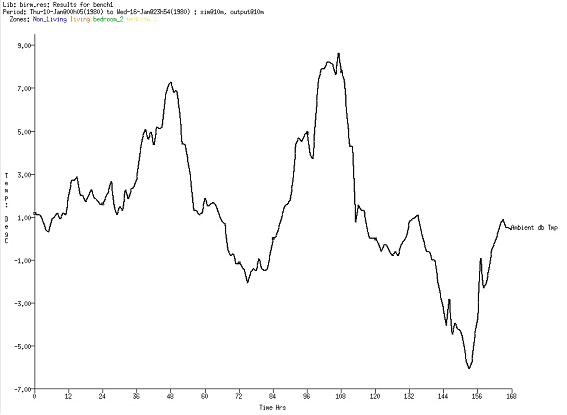
The ambient temperatures during the typical winter and summer weeks employed in the simulations are shown in pictures and below:
Figure 2. Summer week ambient temperature
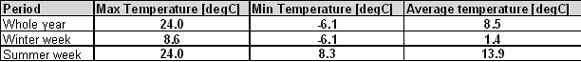
Figure 3. Winter week ambient temperatureRepresentative values of the climate data previously described are shown in table below:
Table 1. Representative values of climate dataThe data obtained from the simulations and hence used for analyzing the energy performance of the dwelling is listed below:
- Heating requirements
- Cooling requirements (when cooling system is considered)
- Zone temperature
- Comfort metrics (in terms of the percentage of people dissatisfied [%PPD])
- CO2 emissions
Results obtained are shown in the Results section.