|
|
|
|
|
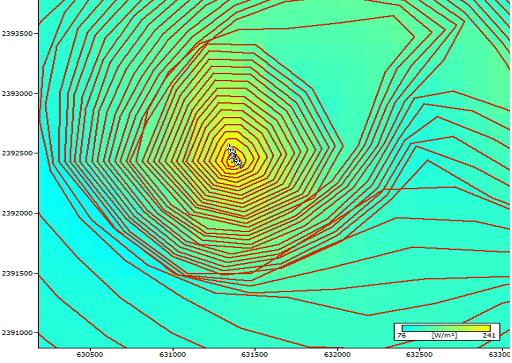
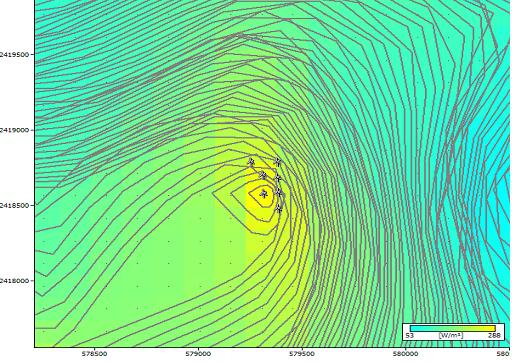
WAsP The reanalysis data and topographical maps are now ready to be entered in WAsP. The normal operation of WAsP is explained here. The main difficulty in using the reanalysis data is that it is not given at any specific point but as an average in the area covered. This problem can be tackled by unticking the "Require and use map location" box in the meteorological station window. Then WAsP can be used normally to produce power density maps and wind farm simulations.
Once the simulation has been proceeded, the energy production and the wind speed of each turbines can be obtained, as well as the whole production of the wind farm and the losses due to the wake effect between the turbines. < Previous | Flow Chart >
|