CFD Model Results and Analysis
Post Processing Results & Analysis
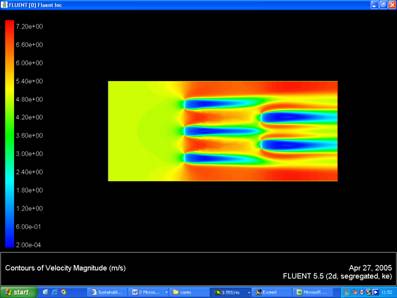
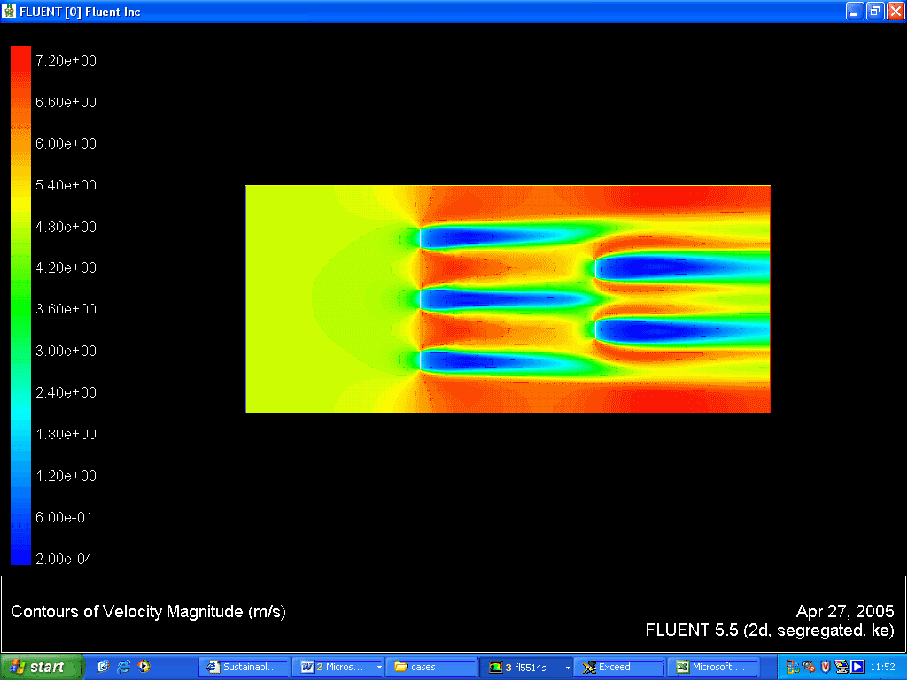
Velocity Contour
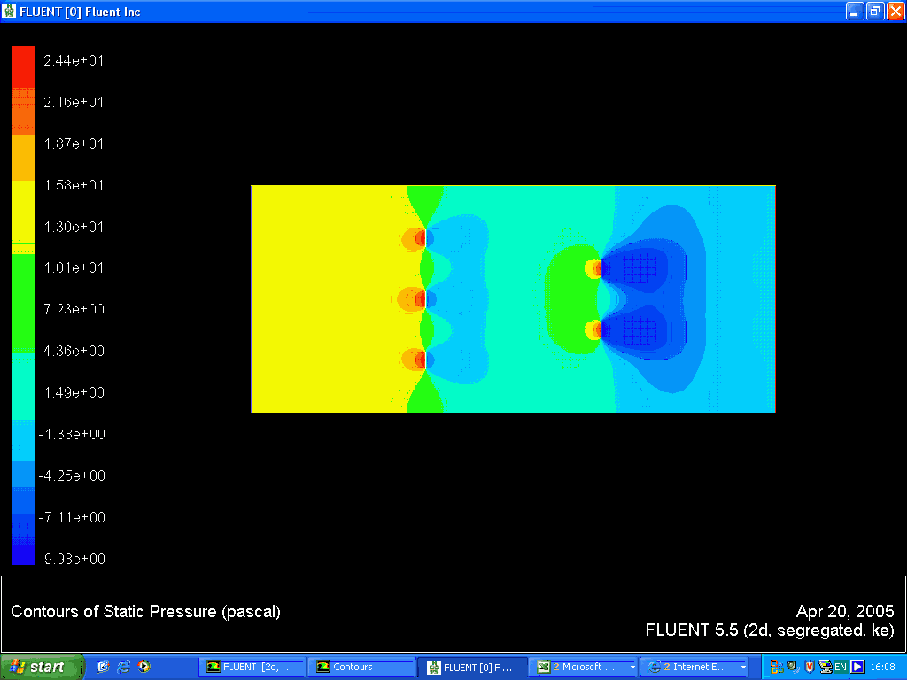
Pressure Contour
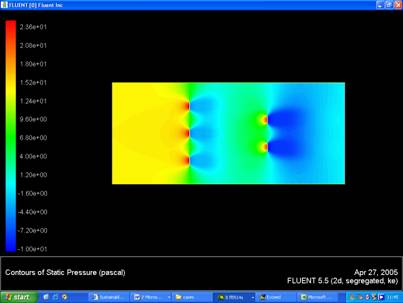
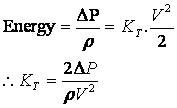
Using the pressure contours it was possible to evaluate the pressure at the inlet and outlet. This gave us a magnitude for the pressure drop across the domain, delta P. It was then possible to evaluate values for K T using the following formula:
This approach was repeated for various values of velocity according to the values for actual velocity in the Pentland Firth channel. Due to time constraints it was not possible to repeat this entire process for the Kyle Rhea channel, but further work could include this.
A sample table for the Pentland Firth velocity data is shown below:

For further details or more in depth analysis please refer to the CFD model spreadsheet.
Having evaluated Kt over a range of velocities corresponding to actual velocity in the channel, it was possible to compare those values with the K T values calculated by the channel model.
- The model performed reasonably well given its restrictions to 2-D
- Getting reasonable velocity and pressure contours
- The K T values obtained were fairly constant
- The K T values produced however were fairly low
- Perhaps 2-D approach and estimation of the MCT as a porous jump is not ideal
Conclusions
- The group has demonstrated a level of capability in this CFD approach towards modelling blockage effects in an array of MCT’s
- The model was able to generate relatively constant values of K T for the array
- Unfortunately the limited 2-D model did not fully capture the entire physics of the system sufficiently to allow validation of K T from channel model
- However, the method was shown to be correct in approach and could certainly be developed and improved by further work
Click below to view the CFD model
Download "cfd_model.xls"
Velocity Contour
Pressure Contour
Further Work
- Extend model to a transient case
- Extend to 3D domain in order to evaluate more accurately the physics of vertical mixing and bottom roughness effects present in a real channel
- Model MCT structure more accurately with rotating porosity to represent the swept area of the rotors
- This more complex modelling approach would be better equipped to evaluate interaction effects between MCT’s
Back to top |