 |
|
 |
|
The cost analysis consists of calculating both the capital and operating cost of a hybrid system like the one in question. In order to achieve that, RETscreen and HyCost tools were used.
The method chosen to study the viability of the project is the Net Present Value method. Net Present Value criterion is an important assessment, which calculates the current value of a future cash flow. Net Present Value is a very useful tool for comparing current costs to undertake a project versus the potentials benefits that the investment will yield sometime in the future. The formula for calculating Net Present Value (NPV) is:
Where:
-
CFn = cash flow in year n
-
i = discount rate
-
n = time horizon of the investment.
It is obvious the Net Present Value of investment depends on the rate of discount used. The criterion, applied, denotes that if the Net Present Value is greater than 0; then the current value of the cash flow generated by the investment is positive.
Calculating sell prices for hydrogen
For our analysis in the transportation sector we chose to use as an example the 2001 base car which we assumed is the average car in the islands. The combined cycle petrol consumption of that car is 7.7 lt/100km [1]. Unleaded fuel in islands is sold at 0.84 €/lt [2]. Therefore we can calculate the cost/ 100km:
C= 7.7∙0.84 = 6.846 €/100km
The combined cycle consumption for a fuel cell car is 6 Nm3/100km according to reference [1]. Therefore, in order to have the same cost of use C, hydrogen should be sold at a price of:
P= 6.846/6 = 1.078 €/ Nm3
For our analysis in the energy sector we were based on the following data. The price of electricity in Greece is 0.05 €/kWh [3]. Electricity in the islands according to the same source is 5 times more expensive than electricity sold in the grid connected areas. Taking into account that 10% of the demand is in the islands and assuming that x is the price of electricity in the mainland and y the price of electricity in the islands then we have the following equations.
0.1∙y + 0.9∙x = 0.05
y = 5x
Solving the system we get that y=0.1785 €
From the above we can easily conclude that selling hydrogen as a car fuel is far more profitable. In order to produce 1Nm3 a typical electrolyser needs 4 kWh [4]. Using numbers from our hybrid systems section we can see that if an electrolyser is supplied with 4 kWh can also give 1.7 kWh of electricity via a fuel cell power plant (efficiency 0.5∙0.85)
So for 1.7 kWh we get:
P= 1.7∙0.1865 = 0.31705 €
Note that the sell price of electricity is slightly different since RE credit was also added to it.
Had we sold the 1 Nm3 as a car fuel instead of converting it to electricity we would get 1.078 €.This illustrates in the best way why transportation is key to the success of those projects.
Net Present Value Calculations
Using the tools available in our tools section, we performed some NPV calculations for our proposed systems in Crete and in Karpathos - Kasos island complex. Those graphs are given below.
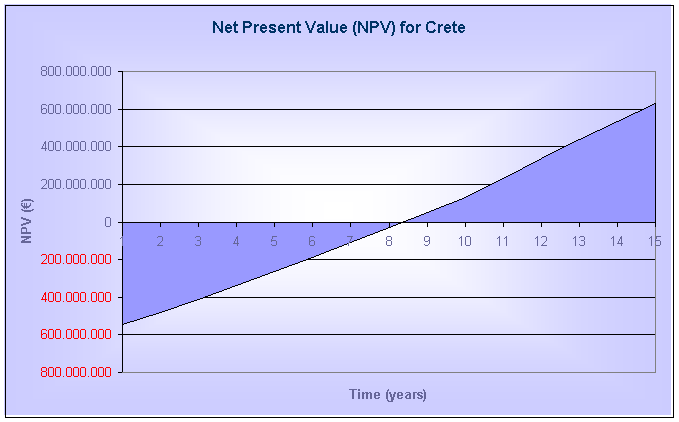
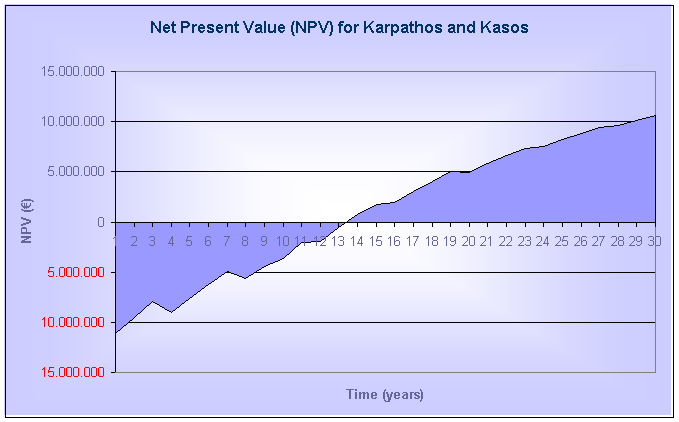
As you can see, payback period for Crete is 8 years and for Karpathos - Kasos is 14 years. This is more or less expected since in Crete no fuel cell plants were used (which are quite costly). This also meant that hydrogen would be sold only as a fuel for transportation purposes and this is by far the most profitable way for using it as we have also seen above.
Capital cost
The costs of the applications used in the development of the proposed Hydrogen Systems are presented in the following table.
|
Hydrogen System Application |
Cost |
| PEM Fuel Cells | 1600 €/KW (5) |
| Electrolyser | 500 €/KW (6) |
| Storage Tank | 310 €/KW (7) |
| Compressor | 1100 €/KW (7) |
| Inverters | 660 €/KW (8) |
| Rectifiers | 300 €/KW (8) |
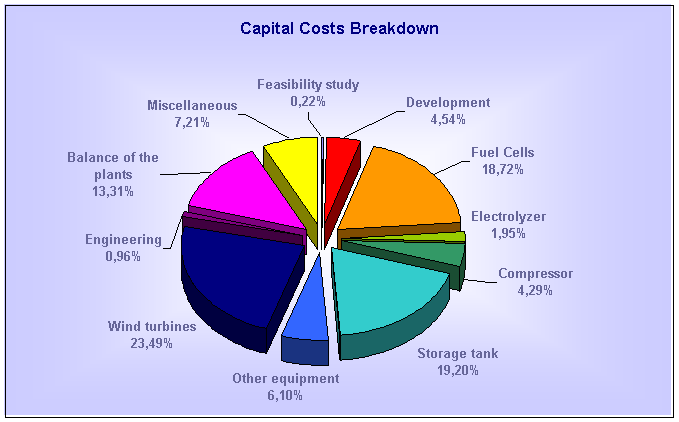
The breakdown of the capital costs of the hybrid system for the Karpathos - Kasos case can be seen below:
|
Capital Costs |
€ |
| Feasibility study | 113,650 |
| Development | 2,330,000 |
| Fuel Cells | 9,600,000 |
| Electrolyser | 1,000,000 |
| Compressor | 2,200,000 |
| Storage tank | 9,842,000 |
| Other equipment | 3,129,500 |
| wind turbines | 12,042,000 |
| Engineering | 493,500 |
| Balance of the plants | 6,823,260 |
| Miscellaneous | 3,696,262 |
Operation and maintenance cost
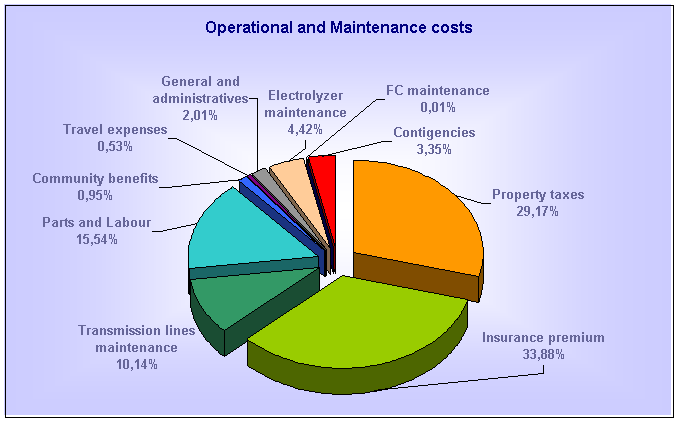
The breakdown of the operational and maintenance costs for the same sstemis provided below. All calculations were done using RETScreen and HyCost.
|
Operational and Maintenance Costs |
€ |
| Property Taxes | 461,965 |
| Insurance prenium | 536,514 |
| Transmission lines maintenance | 160,500 |
| Parts and Labor | 246,013 |
| Community Benefits | 15,000 |
| Travel Expenses | 8,400 |
| General and administrative | 31,861 |
| Electrolyser maintenance | 70,000 |
| FC maintenance | 132 |
| Contigencies | 53,101 |
Periodic costs
Except from the annual operation and maintenance costs we have the following periodic costs
|
Periodic Costs |
€ |
| Wind Turbines drive train (10 years) | 9,850 |
| Wind Turbines blades replacement (15 years) | 9,850 |
| Fuel cell replacement | 3,744,000 |
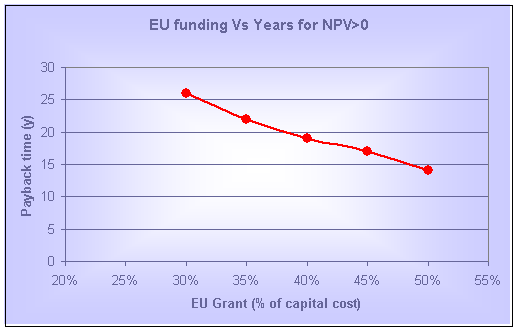
EU funding
The current situation in the EU for funding RE projects is 30-50% of the capital investment. EU funds play a key role in the viability of similar projects. At the graph below you can see how an EU fund affects the viability of our Karpathos - Kasos project. Obviously, as it can be seen in the graph, getting the most of the EU funds can cut the payback period up to 16 years.
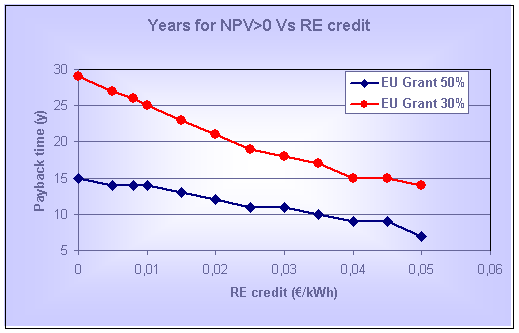
RE credit
The current situation in Greece is to give an RE credit of 0.8 eurocents/kWh to the RE producers for a 15 year time period. This was taken into account in these studies. In the graph bellow it can be observed how an increase in the RE credit would affect the viability of the Karpathos – Kasos complex.
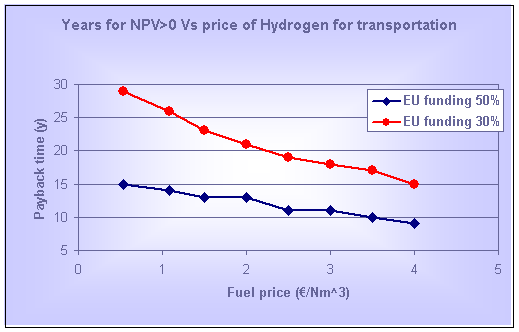
Selling the hydrogen to fuel cars
This is what actually makes our project promising and under numerous conditions viable. The most essential of those is the existence of a market, meaning that all conventional cars are replaced with FC cars. Again, we can see how an increase to the sell-price of hydrogen can affect the number of years for the NPV to be greater than 0.
Future trends
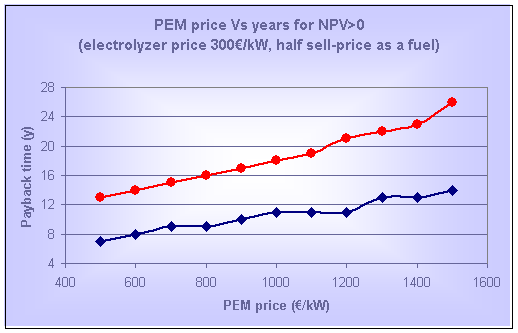
As we all know, fuel cells are an emerging technology. This means that although the costs are not quite sensible in the time being, there is a great possibility for the technology to grow a lot cheaper quickly. It is just a matter of mass production, hence a matter of market demands. As long as governments, the EU, and USA are pushing towards the development of the technology, things seem to be promising. According to some sources near 2010 the fuel cell price will have been decreased to 500 €/kW.
Below you can see how the viability of the Karpathos - Kasos project is linked to the prices of fuel cells, given that the electrolyser cost will drop to 300 €/kW.
It is important to say that these calculations have been done assuming that we would sell the Hydrogen at half price of that calculated.
This is done in order to provide motivation for people to change to fuel cell cars, but also to use the money savings for that in the form of funds for FC cars.
References
(1)
[1] “Comparative assessment of fuel cell cars”, February 2003, MIT laboratory for energy and the environment
[2] “Ministry of development of Greece”
[3] National Electricity Company
[4] PV autonomous installation to produce hydrogen via electrolysis, and its use in FC buses, July 2002, J.M.Vidueira, ,A.Contreras, T.N.Veziroglu[5] Electric Power Research Institute (EPRI) August2002
(2)[6] Hydrogen News, 2003, Harry Brown
(3)[7] “Cost of storing and transporting Hydrogen” NREL
(4)[8]
Price survey for March 2004 from 49 companies from