Other Pages within Calculator:
Within this page:
|
Validation of Calculator
Validation using the Valorga plant at Tilburg, Netherlands
|
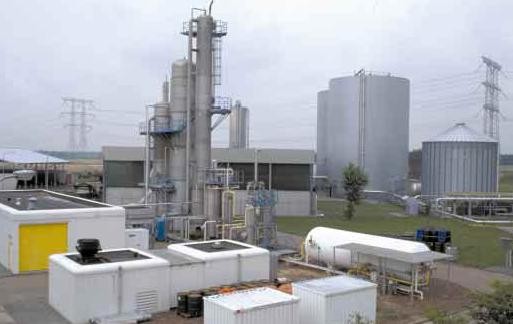
After creating the calculator, the outputs were validated using information from the Valorga plant at Tilburg, Netherlands [http://www.seas.columbia.edu/earth/vermathesis.pdf ]. No information about this plant or its data were used in the generation of our calculator, so it provides an independent validation tool for substantial portions of the calculator functionality.
The Valorga plant at Tilburg
|
The Tilburg plant began its operation in 1994 and treats primarily vegetable, garden and fruit waste (VGF). The plant capacity is rated at 52000 tons/year of VGF, or 40000 tons VGF plus 6000 tons of non-reusable paper and cardboard. A central refuse treatment company collects and separates municipal waste from the participating 20 municipalities. The feed consists of 75% kitchen and garden waste and 25% paper, cardboard. The annual rate of MSW generation in the Netherlands is nearly 450 kg per capita. Thus, the estimated amount of VGF generated by the Tiburg population of 380,000 is 64,000 tons of VGF per year. The plant consists of two digesters, each of 3300m3 capacity, and produces 2.8 million m3 of methane per year (70m3/ton). The waste is sheared to less than 10cm particles before being fed to digestion unit. The retention time in this plant is 20 days at a mesophilic temperature of 38°C. The biogas production can be up to 106 m3 per ton of waste, some of which is pressurized and pumped back into the reactor to improve mixing. The biogas product is piped to an upgrading plant, where it is refined to natural gas quality and then supplied to the municipal network. The biogas contains 56% CH4. The Tilburg facility highlights the technical and economic feasibility of using energy from waste in the form of biogas to generate electricity. The compost product amounts to 28000 tons/year and is reported to be of high quality for agricultural use.
A technical report produced by the Center for Analysis and Dissemination of Demonstrated Energy Technologies (CADDET http://www.caddet-re.org/assets/no154.pdf)analyzed the economic and environmental performance of the Tilburg facility between 1994 and 1999. CADDET reported that the natural gas yield was about 50 m3/ton. The net yield of natural gas, i.e. after providing for heating and electrical energy for the plant, was about 44 m3 of methane per ton of organic material processed. The economic analysis by CADDET reported that the capital investment for the Tilburg plant was equivalent to $17,500,000. The main sources of revenue of this plant are the gate fees paid by the municipalities for waste treatment and the sale of natural gas. Between 1994 and 37 1999, the average fee for waste treatment was $90/ton resulting in the average annual revenue of $3,600,000 per year. Assuming an average gas price of $0.06/m3 (CADDET, 1998), the gas revenues were $81,600 per year. Assuming an administrative and operating personnel of twenty and an average wage and benefits cost of $40,000 per person, the labor cost is estimated at $800,000. Assuming an equal amount for all other costs (maintenance, supplies and materials, etc.), adds another $800,000. For an assumed 20-year life of the plant and at 10% required return on investment, the annual capital charge for repayment of the $17.5 million principal is calculated to be $920,000. Subtracting these three cost items from the annual revenues of $3.68 million, results in a net annual income of $1.16 million. It can be seen that under the above assumptions the Tilburg operation is profitable. The environmental performance of the Tilburg indicates that 1.36 million m3 of methane per year are recovered and used for electricity generation. This corresponds to 728 tons of carbon in the form of CH4. Considering that one ton of
C as methane is equivalent to 21 tons of C as carbon dioxide the Tilburg operation avoids landfill emissions of about 15,000 tons of carbon equivalent.
Validation and explanation of the calculator results
|
The validation was performed by entering the following parameters into our anaerobic digestion calculator:-
- A radius of the inner (suburban) zone of 5km, taken from a map of Tilburg.
- A population of 380,000 people living within this area, from which source separated municipal organic waste could be collected, from an assumed 10 pickup points.
- A radius of the outer (rural) zone of 10km, although no human or animal populations were placed in this zone.
- 16.4 tonnes of paper/sawdust waste were added to the waste stream, at an average collection distance of 3.3km from the plant, from an assumed 10 pickup points. 16.4 tonnes/day corresponds to 6000 tonnes/year.
- All digestate products were assumed to be given away at no charge to farmland surrounding the town at an average radius of 10km. In this analysis, we assume that the plant is liable for all transport costs to the farmland.
- The plant design involves 2 single-phase digesters, at 38°C with an HRT of 20 days. We assumed the digesters to be 95% full, on average. We assumed an insulation thickness (k=0.04W/mK) of 50mm on the digesters, and 100mm on the pasteurisers. We assumed a 3-pasteuriser system since it allows compliance with EU regulations while still allowing efficient heat recovery using constant flows through heat exchangers.
- We assumed an exchange rate of 1.70$=£1.00
- Gate fees were set at $90/1.7=£53 per tonne.
- The valorga plant exported gas directly after refining to natural gas quality, at $0.06/m3, whereas our model converts the biogas directly to electricity and heat. In calorific value, $0.06/m3 for pure CH4 corresponds to 0.06/1.70/11.04=0.003 £/kWh. We set our sale prices at £0.04/kWh for electricity exported, and £0.003/kWh for heat exported.
- We assumed a discount rate of 8% per annum.
- The full capital sum must be repaid over 20 years, and the plant lifetime is also 20 years.
- We assumed that waste feed streams and digestate are transported by lorries with 20 tonne capacities, £40/hour costs, speed=25km/h, pumping speed=50 tonnes/hour, 8 hours a day on 5 days of the week available for deliveries, lorries based 1km from the plant, 1 hour a day driver lunch break, and 3.27 km/litre diesel consumption.
Archived inputs and outputs from our model of the Valorga plant can be viewed at
valorga demographics and valorga results. The outputs of our model can be compared against the reported performance of the Valorga plant.
- Our model predicts that collectable source-separated organic waste from the 380,000 people will be between 76 and 266 tonnes/day, with an expected value of 114 tonnes/day. This corresponds to a range of 28,000 to 97,000 tonnes per year, with an expected value of 42,000 tonnes per year. This figure matches well with the reported figure which is 40,000 to 50,000 tonnes of organic municipal waste per year.
- Our model predicts that, when the 16.4 tonnes/day of paper/sawdust are added to the waste stream, the resulting dry solids content would be 28.8%. Since this is too dry for an anaerobic digestion process, 200 tonnes/day of water must be added to the feed stream. This lowers the dry solids content to 11.4%, which is within the suitable region of 6-12%.
- We can confirm that this amount of water must indeed be added. Adding this amount of water raises the daily feed stream tonnage from an expected 130 tonnes/day to 330 tonnes/day. The resulting required size of the 2 digester vessels for such a tonnage with the 20 day HRT, is predicted by our model to be 3350m3 each. This figure corresponds well to the Valorga reported sizes of 3300m3 each.
- The predicted carbon:nitrogen ratio is about 38. This is relatively high, as the food waste and paticularly the paper/sawdust have relatively high C:N ratios.
- Our model predicts the overall capital cost of the plant to be between £6.4 and £9.5 million, with an expected value of £7.2 million. These figures are of the same order but just a little (30%) lower than the actual Valorga cost which was approximately $17.5/1.7 = £10.3 million.
- Our model predicts an annual capital repayment, over 20 years, to be £730,000. This equates to $1.2 million which is close to the quoted figure at $920,000.
- We predict annual running costs of £500,000 million, or $850,000. Valorga quote double this at $800,000 labour plus $800,000 parts.
- Valorga costs do not include any allowance for transport costs. We predict that annual transport costs will be £250,000 for feed collection and £500,000 for digestate transport; an extra $1.3 million expense incurred that Valorga do not account for.
- We predict gate fees of £2.2 million, or $3.7 million. The valorga quoted figure is $3.6 million.
- Valorga quoted biogas yields are 75-106m3/tonne of feed input (average 90m3/tonne), with a 56% CH4 content. (Note - The figures quoted of 44-60m3/tonne figures relate to synthetic natural gas production after the biogas at 56% CH4 is reduced to pure 100% CH4). Our model predicts biogas yields of between 30-102m3/tonne with an expected value of 80m3/tonne. This matches the Valorga figures well, although our expected figure is a touch lower than their published average. The graph below shows the expected biogas yields from input feed stream sources, in m3/day. The maroon bars are the expected results, the blue bars correspond to the lowest estimate of feedstream tonnages, and the lowest estimate of biogas yields. The cream bars correspond to the highest feedstream tonnage estimtes and biogas yields per tonne.
- Valorga quote a "rate of return" of %10, with annual net profits of $1.1 million. Our model predicts expected annual net profits of £560,000 or $950,000, with an expected IRR (internal rate of return) at 14.9%. These figures show reasonable agreement, although it is not known exactly how the Valorga plant calculated their rate of return.
- The quoted Valorga carbon balance calculation is over-simplified, but their claim is to avoid landfill emissions of about 15,000 tonnes of carbon(equivalent), or 44/12*15000 = 55,000 tonnes of CO2e per annum. Our model for carbon balance accounts for more processes, but is dominated by the avoidance of methane which would be naturally produced by waste in a combination of landfill and spread disposal routes. Landfilled waste typically produces biogas with ~50% methane content, whereas waste disposed by spreading decays more aerobically, producing an equimolar amount of biogas but with very little methane content. Our model takes a 25% average figure for the methane content of avoided biogas release due to alternative disposal routes. Against that, we account for the CO2 released from our Biogas engine, and the transport (diesel combustion). Also, we account for the CO2 releases which are saved due to conventional electricity generation and conventional heat from natural gas that we offset due to our electricity and heat exports. Our balance calculation predicts that the release of 40,000 tonnes of CO2e is prevented per annum, by operating the plant. This matches the Valorga numbers reasonably closely considering that their figures do not account for the additional factors described above.
- The efficiency of the Valorga plant, according to the CADDET report, is approximately 70%. This figure represents the useable exported gas energy divided by the total biogas yield energy. Our model predicts a maximum potential efficiency of 80% if all the available heat power is successfully used by neighbouring customers, although this figure does not account for transport energy use. We do not have a published overall energy balance for the Valorga plant, but our model predicts the energy balance to look as follows:-
It should be noted that our emissions and energy balance calculations account for the ongoing plant processes and directly related transport. Our balances do NOT account for energy and emissions related to:-
- Construction or decommissioning of the plant
- Construction or decommissioning of the transport lorries
- Employee transport to and from the facility
Conclusion of model accuracy
|
Overall, the model produces fair estimates of plant performance and financial viability when compared to the experience published by the Valorga plant. The real figures from the Valorga plant lead us to believe that real biogas yields lie close to our MIDDLE estimates, possibly slightly towards the HIGH side. The capital cost of the Valorga plant was slightly in excess of our HIGH estimate, and is indeed larger than we would expect from comparison with other similar plants across europe. Valorga appears to be have been a very expensive plant to build. In terms of overall financial viability, carbon and energy balance, our model appears to match Valorga experience to a reasonable degree of accuracy.
It would also appear that our LOW estimates provide unrealistically pessimistic estimates of food waste tonnages and biogas yields for domestic waste. However, since this is only one validation case, and no other feed stream materials such as manure have been analysed here, it is not wise to draw any major conclusions about biogas yield predictions in general, or to modify the model based upon solely this one case.
Additional comments about the Valorga plant
|
Having analysed the model outputs for the Valorga plant, it is possible to draw a few conclusions about how and why the plant appears to be successful:-
- The plant is situated close to an urban area, with a high population density. This means that feed stock collection transport costs are relatively small.
- Also, the feed is mainly composed of food waste, which has a relatively high biogas yield per tonne. This means that biogas yields are high while input feed tonnage is minimised; again, this means transport costs are relatively low.
- The biogas yield is increased with paper, which has an extremely high biogas yield per tonne; yet again this helps minimise transport costs.
- In terms of financial viability, the plant gate fees of £53 per tonne apply to the entire waste feed stream since it is all municipal waste. This means that the plant revenues are dominated by a very healthy cashflow from the gate fees.
- Due to all the above factors, a similar project can be expected to offer an IRR (internal rate of return) of almost 15% over a 20 year lifespan, with an overall net present value of £5.5 million, given an initial capital investment of £7.1 million. The plant can be profitable without any grants or subsidies.
- Our model predicts that the biogas yield of the Valorga plant could be increased by decreasing the C:N ratio from 38 to a figure closer to 25.
|