ESP-r
Dynamic Building Simulation using ESP-r
(Environmental Systems Performance Research) permits analysis of the energy and
environmental performance of buildings.
ESP-r is a highly advanced building simulation software package,
developed at Strathclyde University; it has evolved to its existing format over
the last 20 years. The software can be
used for dynamic simulation of existing buildings or new builds.
The ESP-r system is capable
of modelling a building’s fabric, airflow, fluid flow and plant and control. The building is assembled with in three
dimensional wire frame geometrical form comprising separate thermal zones,
operation, airflow leakage distribution and construction attributes. These factors are transformed into groups of
conservation equations which are then integrated at successive time-steps in
response to climate, occupant and control system influences. Furthermore, ESP-r Models can be used to
simulate temporal shading and insolation patterns, explicit radiation view
factors and integrated photovoltaic modules.
The user can design the building with the help of existing or new
databases which contain construction details, climate profiles and plant
components. ESP-r also has the ability
to export models to radiance software to analyse the effects of artificial and
day lighting.
Modelling Strategy
for ESP-r
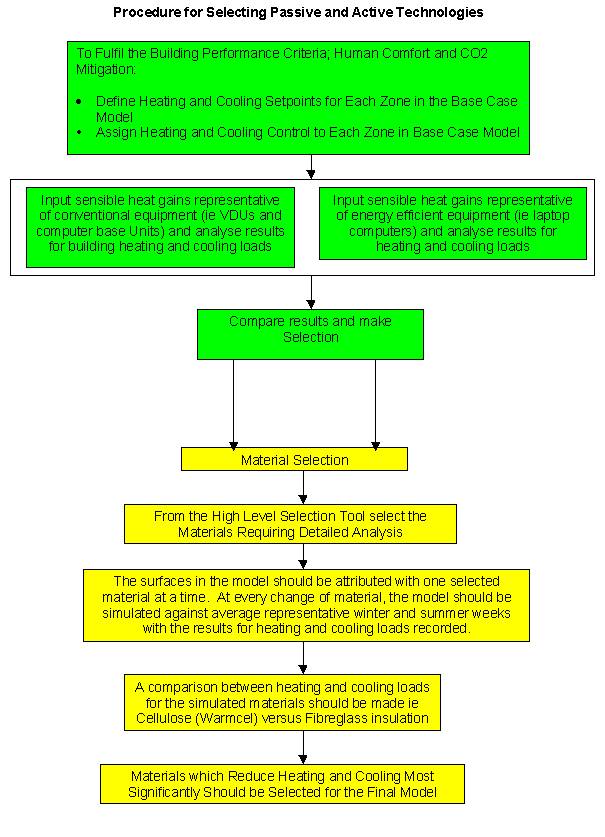
The modelling procedure for the
detailed analysis of the proposed University of Strathclyde building is shown
in the form of a flow chart below. The
flow chart shows that the first stage of any modelling procedure is the
development of a base case model from which any other model changes can be
compared. To fulfil the building
criteria of CO2 mitigation and Human Comfort the procedure for
selecting passive and active technologies can be seen in the second stage of
the modelling strategy. The second
stage involves interchanging active technologies, materials and ventilation
strategies so that the results can be analysed and the appropriate technology
selected.
There was not enough time to learn the
necessary skills required to model the effects of daylighting and artificial
lighting on illuminance in the model, resulting in a more conventional method
of modelling lighting being used. Figures from the Best Practice Programme were
applied to the model to replicate energy efficient lighting.
Base Case Models
The base case model for the
proposed Strathclyde University Exhibition Building were developed from plans
of the building provided by University Architect students. The first step in creating the base model
was to decide which areas of the building would show variations in temperature
so that these areas could be modelled as separate thermal zones. In total there are 9 zones in the
Strathclyde University Exhibition Building.
However, the roof space and air space above Z3 zones are used for
connecting the airflow distribution network between zones in the model. The zones in the model are shown below:
·
Office – Floor Area 870m2
·
Entrance – Floor Area
660m2
·
GF Open Area – Floor
Area 360m2
·
GF Enclosed – Floor Area
540m2
·
FF Open – Floor Area
540m2
·
Top Floor – Floor Area
900m2
·
FF Enclosed – Floor Area
900m2
Simple air infiltration (0.5
ACH) and ventilation rates (0.5 ACH) were estimated for each zone and implemented
in Base Case Models 1 to 5 described in more detail below. The operating hours and
occupancy regimes were kept constant in all of the models. Upon reaching this stage the performance of each
representative model of the building were simulated against average temperature
winter (3rd – 10th February) and summer weeks (15th
– 22nd August). Each zone
was controlled by heating and cooling setpoints so that heating would switch on
if zone temperatures fell below 16°C and cooling would be activated if temperatures exceeded 23°C in the office area and 22°C in all other zones.
The effects of construction materials on heating and cooling loads are
discussed more fully in simulation
results.
Base
case model 1 was constructed with 8W/m2 of lighting in each zone,
populated with visual display units (VDUs) and base units and occupants. The following U-values were used in line
with Building Standards Regulations (Scotland):
·
U-value Walls – 0.3W/m2K
·
U-value Roof – 0.2W/m2K
·
U-value Floor – 0.25W/m2K
·
U-value Glazing – 1.8W/m2K
Base Case Model 1.1
The
only difference between this model and Base Case Model 1 is that Computer VDUs
and base units have been replaced by less energy intensive laptop
computers.
Model 2
In
model 2 Fibreglass Insulation replaced Warmcel insulation in walls, ceiling and
floor giving the following U-values:
·
U-value Walls – 0.21W/m2K
·
U-value Roof – 0.2W/m2K
·
U-value Floor – 0.2W/m2K
·
U-value Glazing – 1.8W/m2K
Model 3
In
model 3 Warmcel Insulation was added to the walls, roof and floor giving the
following U-values:
·
U-value Walls – 0.14W/m2K
·
U-value Roof – 0.17W/m2K
·
U-value Floor – 0.18W/m2K
·
U-value Glazing – 1.8W/m2K
Model 4
Triple
Glazing Argon filled glazing replaced the window construction in model 3
Model 5
Triple
Glazing Argon Filled and Low-emissivity glazing replaced the window
construction in model 4
Model 6
Model
6 comprised an integrated model of the materials that fulfilled the building
performance criteria i.e. low energy and human comfort. The materials and equipment incorporated in
the final building are as follows:
·
Warmcel Insulation
·
Triple Glazing, Argon
Filled with Low-emissivity coating
·
Laptop computers
·
8W/m2 of
lighting
A natural stack ventilation
system was added to model 7 with the design shown in the diagram below. Each dot in the diagram illustrates the
airflow node and the arrows show the direction of airflow through the building. There is one node per zone, with two nodes
outside the building which are wind dependent.
Model
8
The natural stack ventilation system was
replaced with a cross flow ventilation system in model 8 with the design shown
in the diagram below. Once again there is one node per zone, with two nodes
outside the building which are wind dependent.
The results analysis was based upon the materials ability to reduce energy use in the building and achieve comfortable internal conditions for occupants.
VDUs versus Laptop Computers
The graphs below show the results from simulations of base case model 1 and 1.1. The first graph shows that the heating load on the building for the two models will be higher (approximately 1700kWh per week during the heating season) if laptop computers were used as opposed to conventional computers with a 17inch VDU and base unit. The data presented in esp-r also highlighted that some areas required cooling with a total of 680kWh for the building during this winter week
The second graph shows that the cooling
load on the building increases significantly with conventional computers
installed.
Conventional computers will require
more energy for operation (450W per VDU and base unit) and as illustrated in
the graphs, larger cooling loads (approximately 2200kWh per week) resulting in
the installation of air conditioning systems.
Laptops provide a healthier medium to work on than conventional
computers as they have thin film transistor screens which reduce eyestrain.
Although a larger heating load is required with laptop computers in base case
model 1.1 this will be reduced by better insulation. If VDUs were installed along with improved building insulation,
increased cooling will be required during
the winter.
Warmcel
or Fibreglass Insulation?
To investigate whether Warmcel or
Fibreglass would provide the best insulation for the building an analysis
similar to that undertaken for VDUs versus Laptop Computers. The building was simulated for both summer
and winter weeks for Warmcel and Fibreglass insulation.
The two graphs below shows that the Warmcel
insulation reduces the heating and cooling loads. However, it can be seen in both cases that the reduction in
heating and cooling loads are marginal and for a different project where cost
is a consideration it may be that the decision has a different outcome.
Triple Glazing Argon Filled or Triple Glazing Argon Filled with Low-Emissivity Coating?
To model the effects of changing the glazing on heating and cooling loads; the roof area of the roof space zone was changed to glazing. When simulating the effects of both types of glazing during winter conditions the results were identical with 66kWh of heating requirements for the zone. However, during average summer conditions 15 Aug – 22 Aug the results showed that installing Triple Glazing Argon Filled with Low-Emissivity Coating would reduce the cooling load by 60kWh in the summer.
Passive Technology Choice
Based on the results of the dynamic building simulation the following passive technologies are incorporated to meet the building criteria of low energy and optimum human comfort:
·
Warmcel Insulation
·
Triple Glazing, Argon
Filled with Low-emissivity coating
·
Laptop computers
·
8W/m2 of lighting
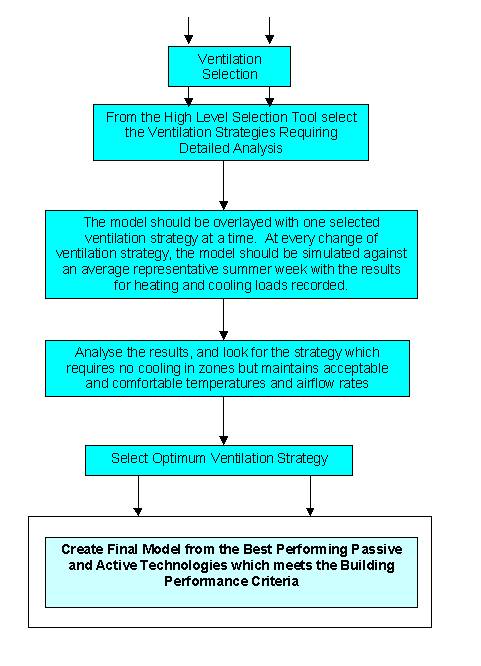
Can Natural Ventilation Reduce the Cooling Load on the Building and Provide Optimum Human Comfort?
The effectiveness of the ventilation
system is totally dependent upon the abilities of the designer. Both stack and crossflow natural ventilation
systems were modelled separately to see which one could provide the building
with reduced cooling and comfortable internal conditions for occupants. An airflow network was added to both
models which the design team felt would be capable of meeting the building’s
requirements. The models were only
simulated during 15 Aug - 22 Aug to
monitor the effects on summer cooling loads.
With heating and cooling setpoint
control on the building initial results for both models showed that a night-time
strategy for cooling, allowing cool air to enter from outside during
non-operational hours, interfered with the heating setpoints. This meant that when cool air was entering
the building, the heating sensor would detect that it was time for the heating
to be activated, hence, negating the effect of the cool air. With heating switching on and warming the
cool air this resulted in very few of the zones needing cooling.
With few zones requiring cooling; the
cooling and heating control on these zones were abolished and the effects
monitored in dry bulb temperature graphs.
The effects of both natural ventilation strategies on the zones without
cooling and heating control produced comfortable room temperatures averaging
around 20°C during
occupied hours.
This strategy permitted analysis of the
effects of the natural ventilation systems on cooling loads in zones which
required cooling.
The most important factor in any
ventilation system is that it can provide an adequate level of air supply to
the occupants whilst maintaining airflow rates which will not jeopardise human
comfort. The CIBSE guide recommends
that occupants in an open plan office space should be supplied with 8 litres
per second per person (reference Table A1.5).
Based on occupancy regimes, the following table shows the airflow
occupant requirements in occupied zones in the building.
|
Zone |
Airflow
Rate m3/hr |
|
Entrance |
1800 |
|
Office |
1000 |
|
Top Floor |
2250 |
|
GF Open |
1800 |
|
GF Enclosed |
2250 |
Cooling Loads for Stack and Crossflow Ventilation
The two graphs below show the areas which require cooling so that comfortable zone temperatures of around 21°C are achieved during occupied hours. The remaining zones do not require heating and cooling loads because both airflow network systems permit warm air distribution providing comfortable room temperatures averaging 20°C. The charts show that both systems are effective in reducing cooling loads on the building, with crossflow ventilation giving slightly superior results.
Stack Ventilation
The two graphs, fig 1 and fig 2, were produced from esp-r and show that the average temperatures in GF enclosed, GF Open area, FF enclosed and FF open and Top Floor approximately 20°C during occupied hours. These graphs are representative of the temperatures in the other zones. Fig 3 shows the percentage of people dissatisfied in FF Enclosed. This graph is indicative of the trend for most all of the zones apart from the office zone fig 4.
fig 2 fig 1
fig 3 fig 4
Crossflow
Ventilation
The two graphs, fig 5 and fig 6, were produced from esp-r and show that the average temperatures in GF enclosed, GF Open area, Office and Entrance. The temperatures in the zones average around 18C during occupied hours, which can be uncomfortable for occupants. This issue is illustrated in fig 7 and fig 8 which show the percentage of people dissatisfied in FF Enclosed and GF open area. In zones FF Enclosed and GF open area the percentage of people dissatisfied average around 13% and 20%. By comparison the percentage of people dissatisfied with stack ventilation FF Enclosed averages around 7%. The worst affected area in stack ventilation is the office with an average of approximately 15% of people dissatisfied.
fig 5
fig 6
fig 8 fig 7
The Importance of Airflow
As previously discussed adequate air
supply is of paramount importance to humans in a highly insulated building. In fig 9 and fig 10 a
comparison is made between airflow rates in crossflow and stack ventilation
systems.
The occupants in FF Enclosed require at
least 2250m3/hr. However,
referring to fig 9 it can be seen that at around 100 and 192 hours there
is barely enough air to fulfil the occupants needs before considering warm or
cool airflow distribution. It can be
seen that there is more than enough air for occupants requirements and warm and
cool airflow distribution using stack ventilation, which is reflected by the
lower proportion of people dissatisfied.
fig 9 Crossflow
fig 10 Stack
|
fig 10 Stack |
Passive Technology Choice
Based on the results of the dynamic building simulation from esp-r the following passive technologies are incorporated to meet the building criteria of low energy and optimum human comfort:
·
Warmcel Insulation
·
Triple Glazing, Argon
Filled with Low-emissivity coating
·
Laptop computers
·
8W/m2 of
lighting
·
Stack Ventilation
The summer cooling load for the case study building based on average ambient summer temperatures over a 16 week cooling period is around 6400kWh.
The space-heating load for the case study building based on average ambient winter temperatures over a 36 week heating period is around 86,760kWh.