Core Two
The Case Study (proposed University
building for the Rottenrow site)
In 2002 the demolition of the old
Rottenrow maternity hospital sited across from the James Weir engineering building
at the University of Strathclyde in Glasgow was completed. The site is now
currently lying empty. At the time of writing there are plans for the
construction of gardens on site, these gardens may not be permanent. There is
some discussion of construction of a new building which will act as a meeting
point for student in the top floor café, a large open area to use laptops (plug
and play), the building may also act as a hub for the university from which
there will be easy access to all other university buildings.
Several students from the
architecture department at Strathclyde (Integrated Building Design) as well as
Dr. Howieson from the Architecture Department produced some architectural
drawings during the first semester 2002/2003 for a proposed building based on
this building concept. Our team was briefed on the concept at the beginning of
February 2003. The initial idea was to design a building which was a low energy
use building which would act as an example of low energy architecture and also maintained
excellent levels of human comfort.
Building Concept/Remit
After some discussion with the
members of the design team from the architecture department it was decided to
go with the initial building concept. There were many aspects of the design which
were not yet finalised thus our team made some decisions regarding the function
of the building, area and rooms within the building as well as the occupancy
regimes and other factors critical to the design.
The following areas were decided
upon.
- The occupancy of the building is estimated to be
around 300 people maximum.
- The total floor space in the building is
estimated at 3000m2
- Café on the top floor of the building; a place
to come, relax and experience the essence of the university. Open 09 -17 weekdays
during term time.
- A large area for laptop use as well as a quiet
relaxed area for study. Open 09 until 22 mon to fri, 09 untill17; sat and
sun.
- A large exhibition area for the construction and
display of models for all faculties. Open 09 until 17; mon to fri.
- Entrance area; open when building is occupied.
- Offices; open mon – fri 09-17 all year (some
office may be closed.
This case study shall act as a
working example of the total integrated building design methodology which was
constructed by our team during core one of our project.
The primary objective was to use
the methodology to determine the renewable and passive technologies, which
would be suited to reducing the energy consumption from the grid and fossil
fuels technologies towards reducing the emission of CO2 during the
use phase of the building. The methodology was to be worked through stage by
stage.
The planned outcome was to show
that the methodology helped in the integration of the most suitable
technologies from the very first stage of the building design and would help
reduce the time required for the elimination of those technologies which were
not suitable for inclusion within the building.
Following the Methodology
First stage
The first stage of the methodology
involves the determination of the building concept and the production of the
draught architectural drawings. The fist stage in the methodology states that
architects, integrated building energy system designers and any other designers
working on the building should converse at an early stage. In this case the
rough architectural drawings were produced by the architecture department
during the first semester. Our team was thus unable to take part in the
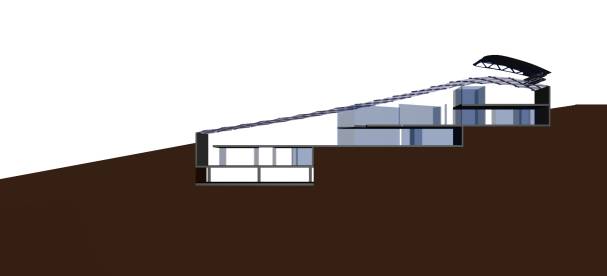
production of the rough architectural drawings. The building concept or remit had already been stated. The draught architectural drawings are shown
below.
The number of occupants had been
stated to be around 300 maximum.
Stage Two
The most interesting consideration
for this site is the slope on which the building is to be constructed, the
slope is estimated to be around 20 degrees at points. It can be seen that the
draught architectural drawings show that the building is designed with a
sloping roof of around 20 degrees south. It should also be stated that there
are some tall buildings directly south of the building which could result in
some shading of the building. Due to the very short time frame in which this
project was to be complete there was no time to conduct a survey of the site.
Therefore it was decided in terms of analysis of renewable technology zero
shading would be assumed. It was also assumed that as the building would not be
considered for construction for at least five years there would be limited
significance in reviewing those issues associated with planning permission.
Stage Three
The various zones or areas within
the building have also been defined in the concept/remit section.
All the most vital areas in the building have been designed. There are some
area within the building which have not been included in the project remit,
these area include toilets which would have a limited effect of the electrical
use within the building. The toilets have been considered with respect to the
use of water by the occupants. The main electrical equipment contained with the
building for the main area is as follows.
Plug and play area – 50 laptops
(60KW)
Café – 4 fridges of 500W, other
kitchen electrical equipment is estimated to be around 4KW at peak times.
It should be stated that this
estimation of the electrical equipment is on the conservative side. There would
likely be other electrical equipment such as lighting control (if appropriate),
monitors for security purposes and radios. It is estimated that
Stage Four
The average internal room
temperature (20°C) of and
airflow rates (0.5 Air Changes per Hour) were based upon guidelines from the
CIBSE guide.
Stage Five
The number of occupants has been stated
to be a maximum of 300. The following regimes were decided upon for the most
important areas i.e. those area with the largest floor areas with in the
building.
|
|
Plug and play area |
cafe |
Exhibition area |
|
Term time, winter |
|
|
|
|
Weekday |
09 – 17 = 100% peak occupancy 17 – 22 = 40% peak occupancy |
09 -17 =100% of peak occupancy 17 – 22 = closed |
09 – 17 = 100% of peak occupancy |
|
Weekend |
09 – 17 = 40% peak occupancy 17 – 22 closed |
closed |
Closed |
|
Periods of immediately prior and after to term time |
|
|
|
|
Weekday |
09 – 17 = 75% peak occupancy 17 – 22 = 20% peak occupancy |
09 -17 =75% of peak occupancy 17 – 22 = closed |
09 -17 = 75% of peak occupancy 17 – 22 = closed |
|
Weekend |
09 – 17 = 25% peak occupancy 17 – 22 closed |
09 -17 = 25% of peak occupancy 17 – 22 = closed |
Closed |
|
Holiday period (mid summer) |
|
|
|
|
weekday |
09 – 17 = 25% peak occupancy 17 – 22 closed |
09 -17 = 25% of peak occupancy 17 – 22 = closed |
Closed |
|
weekend |
09 – 17 = 10% peak occupancy 17 – 22 closed |
09 -17 = 10% of peak occupancy 17 – 22 = closed |
Closed |
Stage Six
This stage involves the static
heat calculations for the entire building.
The equation Q = U A ∆T is used,
the flowing table details the values obtained for The static heat load
calculations are based upon the temperature difference between outside and
inside for the Glasgow climate.
|
Day of Month |
Average Daily Temperature C |
Delta T C |
Heat Loss (with roof U-value of 0.2) kW |
Heat Loss (with Glazing on roof U-value 1.8) kW |
|
January 8th |
-3.4 |
23.4 |
108.8 |
179 |
|
January 16th |
1.3 |
18.7 |
89.55 |
143.1 |
|
February 8th |
2.7 |
17.3 |
82.08 |
132.4 |
|
February 23rd |
5 |
15 |
71.45 |
114.8 |
|
March 3rd |
6.7 |
13.3 |
63.26 |
101.8 |
|
March 20th |
7 |
13 |
61.4 |
99.47 |
|
April 10th |
6.6 |
13.4 |
63.29 |
102.5 |
|
April 25th |
9 |
11 |
51.95 |
88.3 |
|
May 5th |
11 |
9 |
42.51 |
72.31 |
|
May 16th |
14 |
6 |
29.12 |
51.07 |
|
June 10th |
17 |
3 |
14.17 |
28.12 |
|
June 29th |
19 |
1 |
4.72 |
11.09 |
|
July 18th |
21 |
- |
- |
- |
|
July 31st |
21 |
- |
- |
- |
|
August 9th |
19 |
1 |
4.72 |
11.09 |
|
August 24th |
18 |
2 |
9.47 |
17.02 |
|
September 8th |
13 |
7 |
33.06 |
53.56 |
|
September 21st |
12 |
8 |
37.78 |
59.49 |
|
October 1st |
11 |
9 |
42.51 |
72.31 |
|
October 19th |
10 |
10 |
47.23 |
76.51 |
|
November 3rd |
7 |
13 |
61.4 |
99.47 |
|
November 25th |
4 |
16 |
75.57 |
122.4 |
|
December 6th |
8 |
12 |
56.68 |
103.5 |
|
December 18th |
3 |
17 |
80.29 |
128.4 |
There is a large variation in the
space heating loads for the building between the winter and the summer period;
this would be expected of most buildings in colder climates such as those in northern
latitude countries.
Stage Seven - Calculation of the hot water demand
The hot water demand is calculated
as follows.
Peak occupancy = 300
Daily use of water per person = 5
litres
Tin = 10
Tout = 43
∆T = 33°C
Heat capacity of water = 4.2 KJ/KgoC
Peak daily consumption from hot
water use = (300 * 5 * 33 * 4.2)/3600 = 57.75 KWhr
The following table shows the
demand for hot water throughout the year
|
period |
Hot water demand (KWhr) |
|
Weekdays (06/01 to 02/06) |
57.75 |
|
Weekdays (22/09 to 31/12) |
57.75 |
|
Weekend 1 (04/01 to 07/06) |
50% peak demand = 28.875 |
|
Weekend 2 (20/09 to 27/12) |
50% peak demand = 28.875 |
|
Weekend 3 (07/06 to 20/09) |
50% * 25% peak demand = 5.775 |
|
Holiday period 1 (01/01 to
04/01) |
0 |
|
Holiday period 2 (01/06 to
20/09) |
= 14 .4375 |
Stage Eight - Determine the electrical loads within the building.
It is critical that the equipment
required for the various areas within the building is properly defined prior to
this stage. The electrical demand was calculated as follows:
A lighting value of 8 W/m2 was
selected based around 60% of the guideline value of BIBSE. This guideline value
is based upon the minimum illumination required. This was reduced as it was
concluded that through the installation of energy efficient lighting this value
could be reduced substantially.
Thus the maximum lighting load is
estimated to be 3000 m2 * 8 W/m2 which equals 24 KW.
One of the primary conceptual
ideas of this proposed building is the plug and play areas where students can
plug in their laptops and have access to other machines such as scanners and
printers. Since the majority of electrical demand in this area would be derived
from the use of laptops, the electrical demand from appliances within this plug
and play area was calculated based upon the estimated peak number of laptops.
It is estimated that during peak period there would be approximately 50 laptops
in use, most laptops are rated at around 60W thus 50 * 60 equals a peak
electrical use from laptops at 3KW.
There will also be significant
demand from the use of electrical equipment contained with in the café. It was
estimated that the café would require 4 refrigerators which are rated at around
500W, this equated to a demand of 2KW. It is estimated that other electrical
appliances such as kettles and whisks would require around 4KW of electricity
during peak periods.
As the university is not occupied
100% of the time there will be a reduced electrical demand over much as the
year.
The peak electrical demand is
calculated to be 24KW + 6KW + 3KW which equal 33KW.
The following was then assumed for
the various demand periods. It should be noted that the demand from the
electrical side will not match to exactly the reduced occupancy side.
- Weekday > Fully occupied winter (term time)
- 09 -17 > 100% of peak loads
- 17 – 22 café closed
= 40% of laptops in use
= 20% of lighting demand
This equates to an electrical
demand of approximately 11KW
- Fully occupied during summer period
= 90% of electrical demand
This equates to an electrical
demand of around 30KW
- Reduced load period (outside of term time)
=75 % of Peak electrical demand
This equates to an electrical
demand of around 25KW
- Mid summer period (university sparsely occupied)
=30% of peak electrical demand
This equates to a demand of around
10KW
- Weekend period
=30 % of peak electrical demand
This equates to a demand of around
10KW
Stage Six – The high level Elimination Tools
High Level Tool for Renewable Technology
- The essence or key to using the high-level
selection tool is following the steps/guide given prior to the table.
- The first two criteria which must be reviewed
are the first two criteria in the table, which is the demand profile for
electrical energy as well as for space heating and hot water. Some
technologies can be eliminated at this stage.
§
CHP is ruled out at this stage as it does not match those
criteria which are necessary for CHP to act as an effective environmental and
economic strategy. This is due to the variation in the heating requirements for
the building and an electrical demand regime which is not consistent. It is
stated in the selection tool that a CHP plant need to be run at maximum
capacity for as much time as is possible. This would not be an effective
strategy for the Rottenrow site; thus CHP is eliminated.
§
Small or micro hydro can also be eliminated at this stage.
The electrical demand from the building would not warrant construction of a
hydro facility as the supply would be in considerable excess to the demand. In
some case there may be a partnership between several businesses or residential
bodies, in other cases a hydro facility could supply the electricity for to
several university buildings. In this case such a partnership does is not
possible.
§
The efficiency of the fuel cell system which only provides
electricity is considerably less than for a system incorporating cogeneration,
where both the electricity and heat produced from the fuel cell are used within
the building. In the table it is stated that the ratio of heat to electrical
energy produced from the fuel cell is quite high. The Rottenrow building has
been shown to have a heating demand profile which varies considerably
throughout the year as does the hot water demand. This would mean that during
the summer periods of the year the fuel cell would be operating on an
electricity producing cycle only. This would mean that the overall yearly
efficiency of the fuel cell system would be reduced. This in its self would not
necessarily rule out fuel cells from further consideration in the other
categories which are driving the design of integrated renewable technology for
the Rottenrow building.
- The main driver in the construction of the Rottenrow
building has been stated to be a low energy building which has minimum
emissions of CO2 during the use phase. Thus the category with
the most importance for the Rottenrow building is CO2
mitigation. The remaining technologies are then reviewed with respect to
the potential they have for reduction of CO2 or CO2 mitigation.
Only through reading the information for each technology with respect to
the CO2 mitigation category is it possible to conclude that all
the remaining technologies have potential to result in a decreased CO2
emission when compared to standard technologies. The exact levels of CO2
mitigation are not known. Much is dependent on the fuels they may replace
as well as many other external factors.
- The next category for analysis is that of cost
uncertainty. Cost uncertainty will play a vital role in the decision
making process for most organisations. It is not good practice to opt for
a technology which may cost far more than initial investigation may
detail.
- Of the remaining technologies Biomass is ruled
out due to the associated high levels of cost uncertainty.
- BIPV as a technology is not ruled out at this
stage, however, film PV modules are ruled out due to the problems with
reliability and thus significant levels of cost uncertainty.
- Ducted wind turbines will also have a degree of
cost uncertainty as they are currently still in the design phase. It is
however estimated that that in the next five years when construction of
the building may begin that the cost uncertainty associated with the
ducted wind turbines will be significantly less than it is currently. It
is also estimated by some of the leading experts at the University of
Strathclyde such as Dr. Andy Grant that the cost of power derived from
the ducted wind turbines could be comparable with that of PV modules.
- Fuel cells are still a fairly new technology
and are thus subject to significant levels of cost uncertainty. One of
the main uncertainties with fuel cells is the cost of natural gas which
is likely to vary in the next few decades. The maintenance of fuel cells
may also add significant costs uncertainty to the system. Fuel cells are
thus ruled out at this stage due to the associated uncertainties.
The remaining technologies are thus
BIPV, Solar Collectors, Ducted Wind Turbines and GHP. Each of these
technologies shall be subject to further investigation in the quantitative
analysis section.
Stage Seven –
Detailed Analysis for the renewable technologies deemed suitable for
integration into the building by the high-level selection tool
The strategy
The first stage in the detailed
analysis of the renewable technologies viable for integration into the proposed
Rottenrow building involves the study of the demand and supply matching capabilities
of each technology. A strategy for carrying out the supply and demand analysis
for the various technologies was carried out. The strategy is presented below
- Convert the electrical demand profile values
calculated from the equipment contained within the building to Data which
can be interpreted by Merit
- Convert the hot water demand profile from the
static calculations to Data which can be interpreted by Merit
- Obtain information; cell characteristics and
module cost for various PV modules.
- Using Merit determine the annual deficit and
excess of electrical load for the hot water building for various PV module
types.
- Use cost as a tool for selecting the module type
which would be most effective for installation into the building.
- Use CO2 mitigation for determining
the optimal area for installed area of PV.
- Use deficit and excess of annual hot water
demand for the Rottenrow building.
- Use CO2 mitigation as a tool for the
selection of the type of solar collector
- Use CO2 mitigation for selection of
optimal area of solar collector.
- Analyse the potential of various amounts of
installed DWT for mitigation of CO2 and thus chose number of
installed DWT.