|
Here
we present a brief overview of our demonstration equipment, and of the
view a 'health and safety manager' might get on their e-services webpage.
Our
test equipment comprised of an Ericsson e-Box, a PC acting as a webserver,
database, and web browser, and equipment for attaching a sensor to an
RS232 port on the e-Box. Note that although radio frequency sensors
are simulated in the case of CO, we also have access to working RF sensors
for other applications.
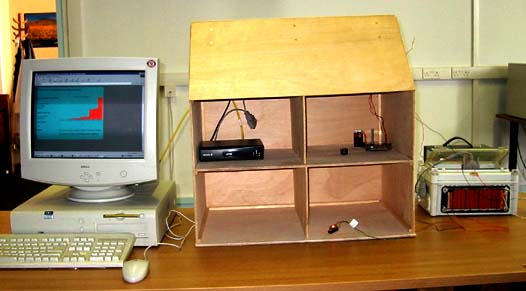
The
e-Box is housed within our demonstration house, in the top left hand
'room'.
Due
to safety considerations, we could not test a working CO sensor with
our equipment so we built a small circuit from which we could regulate
an output signal - see the top right 'room'. To the right of the picture
is the delta logger with which we translated the signal to a format
the e-Box would understand.
The
picture on the left is a dynamic graph of CO levels, determined by adjusting
our simulated sensor.
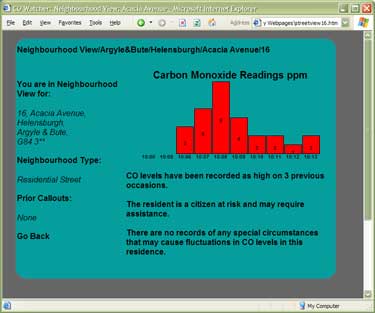
Here
is the aforementioned graph, as accessed by a health and safety manager
in our service.
We
also envision giving the manager information that may be useful in diagnosing
problems i.e. whether the street is situated in an area that may suffer
from outdoor pollution, and whether there have been problems in the
street or house before.
The
graph will help the h&s manager to diagnose whether the alarm is
a brief spike or a long term problem, and they can act accordingly.
|