Back to home page


DEMAND

In this section an estimate has been made of a demand profile prediction for the secondary

distribution network of the case-study.This was achieved through the following steps:


  1. Collection of electricity consumption data for the average UK customer, based on data

    at half hourly intervals over a typical winter day and a typical summer day.  Profiles for both

    domestic and non-domestic customers were available.To view this data goto www.electricity.org.uk/uk_inds/load2pro.html

  2. Determining the number of domestic customers (from population data) and

    non-domestic customers (factories, shops, hotels, etc.).  To view population data for the case-study click here.

  3. Calculation of typical demand profiles for the whole secondary distribution network in winter and summer. 

    Finding annual average for daily electricity consumption.

  4. Determining a breakdown of electricity usage in the case-study area.


    -         lighting - 40%

    -         heating - 30%

    -         other - 30%

Lighting and heating are both seasonally dependent, lighting varying with lengths of daylight, and heating

varying with ambient temperatures.  Other electricity usages were considered to be seasonally invarient.


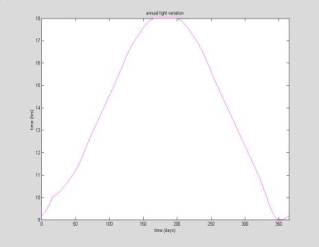
Determining annual variation of daylight times we get the following graph.


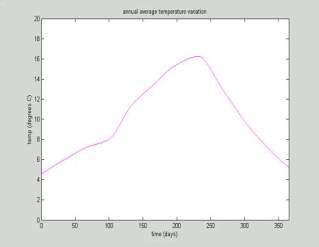
Estimating annual temperature variation, from Met. Office statistics we get.


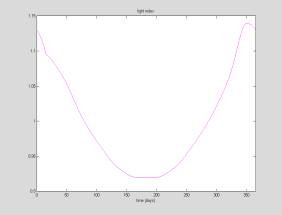
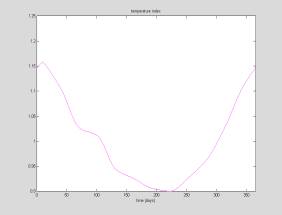
By inverting these variations, and scaling to an average of one, the following lighting and heating indexes were formed.


By apportioning 40% of the lighting index, 30% of the heating index and 30% of a unity index to the daily average annual consumption profile, the prediction annual demand profile for the case study was calculated, as shown in the following figure.

x


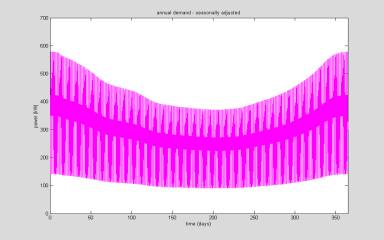
The above figure shows the demand profile prediction for the secondary distribution network of our case-study during a typical year . (The elaboration of the data and the formation of the graphs were made in Matlab software).


Back to home page