[Interesting Figures]
Electricity Generating Capacity, Renewable Energy, Longannet Power Station, Nuclear Output, How many Wind Turbines to replace Nuclear Power
![]()
Electricity Generating Capacity
Once we know how much electricity our own home requires we can begin to understand how much electricity some of Scotland's large power station are capable of producing.
Many figures can be associated with electricity generating stations, how much electricity they produce during a year, how often the plant is running during the year (capacity factor) and also figures announcing that they how many households that they can provide electricity for.
Such figures vary greatly between different sources depending on the inclination of the organisation or company. Similarly figures can vary greatly between differing energy sources, e.g. coal power stations, nuclear power stations, wind farms, Energy from Waste (EfW) plants. This has all to do with the capacity factor of the energy generating source.
There is a lot of confusion about the difference between Capacity Factor and Load factor so here is a definition of both.
Capacity Factor: The capacity factor is the actual power produced over a period of time expressed as a percentage of the power that may have been produced if the station was running at full power for that period.
A 10MW rated wind farm could theoretically produce 10 * 8760 = 87600000kWh/year but if it only produces 3066000kWh/year it has a capacity factor of 35%.
The average capacity factor of all installed wind plant in Scotland is in the region of 35-40%.
Load Factor: The load factor is the ratio of the average load to the peak load during a period of time.
If over a period of time the average load is 40MW, but at one specific period the load jumped to 100MW - then the load factor would be 40%.
The capacity factor should not be confused with declared net capacity.
Declared
Net Capacity (DNC): The DNC is the maximum rating of the generating station
less the power required by itself at which the station can run continuously
if required.
DNC represents the nominal maximum capability of a station's supply electricity
to consumers.
DNC = installed capacity - 'in house' load
A generating station with an installed capacity of 10MW, which requires 500kW for operation would have a DNC of 9.5MW
Due to the intermittent nature of some renewables they cannot be relied upon to generate electricity. Most electricity distributors need to be guaranteed the capacity that they can supply. This is not as easy to estimate with renewables due to the intermittent nature of the source of electricity - we do not always know when the wind is going to blow, or if the sun is going to shine.
This means that to meet say a SRO for 100MW a wind farm would need an installed capacity of approximately 250MW
Longannet is a coal fired power station and has an installed capacity of 2400MW made up from four 600MW generators. The declared net capacity is rated at 2304 MW as each generators maximum output is 576MW of electricity - due to heat loss and mechanical losses loses that may occur in the process. This reduced figure also accounts for the fact that some of the electricity generated is utilised in the running of the plant at Longannet - most stations typically use some of the power they produce to help them run.
i)
From this figure of 2304MW you could expect the station to produce 2.304 GW
x 8760 hours = 20183GW of electricity a year
(2304MW = 2.304GW)
ii)
On average Longannet produces 10,417 GWh per year.
Taken from the (Eco Management and Audit Scheme) EMAS statement produced by
Longannnet for the period of 1999 -2001.
This is largely due to the fact that the station cannot run all the time, nor
is it necessary to run all the time. From the two figures above we can approximate
how often the station is actually running.
10,417 Annual Electricity Production
2.304 GW x 8760 Hours = Declared Net Capacity * hours per year
This
figure is termed the capacity factor and illustrates that the station would
running about 51% of the year, about 180 days on full capacity to produce this
much electricity.
It is more likely the station is running nearly constantly as it is not very
efficient to switch large power stations on and off. This puts strain on the
plant and machinery and also means that the power station cannot 'come online'
very quickly if it has been shut down and there is a sudden need for electricity.
This is were renewable energies such as hydro are ideal for meeting large surges
in electricity demand, i.e. when people put the kettle on during television
commercial breaks.
It is more likely that stations such as Longannet operate at capacity under the its maximum to achieve this yearly total. The following example shows how this could be achieved;
Rather than the maximum 576MW that one generator can produce it is more probable that each generator will operate somewhere around 400MW for a longer period - rather than flat out for 180 days and then stop.
Four Generators operating at 400MW = 1.6GW capacity
i) The plant is likely to run for 7000 hours a year.
This allows (8760-7000) 1760 hours or 5 days a month for scheduled maintenance to take place and also any problems that may arise.
Using these assumption we can calculate that Longannet will produce 1.6 x 7000 = 11,200GWh which demonstrate a more likely electricity production that relates to the average production figures. There are many more possible ways to achieve this number.
For example only 3 generators may be running at one time so they would have to work at a higher rating for longer - 3 generators at 470MW would have to work for 8000 hours to produce 11,200GWh electricity. The number of generators producing electricity and also at what rating they are producing electricity can vary hugely over the year, as fossil fuel stations try to meet the secondary demand not base load.
How many Wind Turbines to replace Nuclear Power
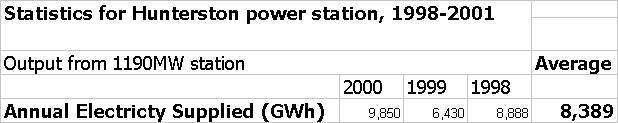
Hunterston
= 8,389,000 MWh/year
Torness = 8,727,000 MWh/year
Longannet = 10,417,000 MWh/year
Westfield
Biomass Plant = 10MW
Greengairs Landfill Gas Plant = 8MW
Windy
Standard Wind Farm = 21.6MW (36 x 600kW) (Farm Area 3500000m2)
Windy Standard = 21.6 x 0.35 x 8760 = 66225.6 MWh/year
Assumed
Capacity Factors: Onshore Wind = 35%
Biomass = 99%
Nuclear = 90%
Coal = 40%
How
many 600kW Wind Turbines Equivalent of Above?
Number of Turbines = MWh/year .
8760 x 0.35 x 0.6
Hunterston
= 5100 Turbines
Torness = 5358 Turbines
Longannet = 4572 Turbines
Using Windy Standard Data: Area of single turbine = 3500000/36 = 97222.22m2 = 0.097222km2
Area required to replace Power stations listed above with 600kW turbines?
Area
Required = Number of Turbines x 0.097222
Hunterston = 495.83km2 (0.63% of total land area of Scotland)
Torness = 520.92km2 (0.66% of total land area of Scotland)
Longannet = 444.49km2 (0.56% of total land area of Scotland)
Area
of Scotland = 78,722km2 (www.worldatlas.com)
Area of Glasgow = 177.3km2 (www.glasgow.gov.uk)
Area of Edinburgh = 261.3km2 (www.edinburgh.gov.uk)
To replace all above Power Stations = 1461.24km2 = 1.86% of total land area of Scotland
Or
To replace Hunterston, Torness and Longannet with Wind turbines would require a land area approximately 8.24 times the size of Glasgow or 3.33 times the size of Glasgow + Edinburgh.
Obviously the Wind turbines would not require to utilise all the land area but only approximately 1% of it will actually be used. The land would still be able to be used for agriculture and other activities but any structures built would affect the performance of the turbines.
Using the same methodology as above calculations to see if the Power stations could be replaced by biomass plants. Information is used from existing biomass plants that are described in the Case Studies Section.
Westfield
= 10 x 0.99 x 8760 = 86724 MWh/year
Greengairs = 8 x 0.99 x 8760 = 69379.2 MWh/year
Hunterston
= 108 Westfields = 135 Greengairs
Torness = 114 Westfields = 142 Greengairs
Longannet = 97 Westfields = 121 Greengairs
![]()
Home, Beginners Guides, Case Studies, Small Scale, Large Scale, Urban Applications
![]()