[Carbon Dioxide]
Electricity Consumption and Carbon Dioxide, Scottish Household Electricity Consumption, Scottish Household Carbon Dioxide Emissions, Renewable Energy and Carbon Dioxide, Standby Electricity and Carbon Dioxide, Television and Video, Kitchen Appliances, Bedroom, Bathroom, Conclusion
![]()
Electricity Consumption and Carbon Dioxide
From the Scottish Database section we can see how much carbon dioxide
is emitted in Scotland as a whole, however we are just going to focus
on carbon dioxide emissions due to electricity use in Scottish homes.
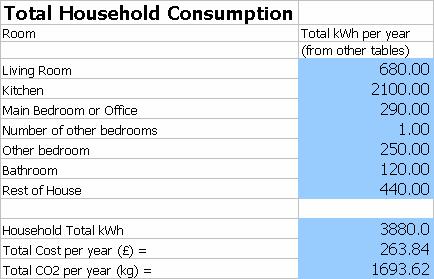
The average household that consumes 3,880kWh per year on electricity pays
£263.84 annually on electricity – this figure does not include
standing charges, and other costs.
Needs to include Daily Standing charge of 11p per day = £40.15
and VAT at 5%. Typical yearly bill approximately £320
Scottish Household Electricity Consumption
Assumptions
2, 350, 000 households in Scotland – approximation for 2002. [1]
2. 3,880kWh - as shown in household electricity consumption section, illustrated
below using our average consumption figures.
2, 350, 000 (households) x 3,880 (kWh) = 9,118,000,000 kWh
= 9,118 GWh

Electricity use in Scottish housing accounts for 9,118 GWh, this is equal to 28% of Scottish total annual energy consumption (32,037 GWh).
Scottish Household Carbon Dioxide Emissions
Every house that uses electricity is also responsible for carbon dioxide emissions. The Home Electricity Consumption Guide indicates how much CO2 is typically emitted due to electricity use in the home.
Average emissions from home electricity use = 1693.62 kg of CO2 annually,
the equivalent weight of a large family car.
Using the average emission figures above we can calculate contribution to Scotland’s CO2 from housing.
2, 350, 000 (households) x 1693.62 (kg) = 3,980,007,000 kg
Housing in Scotland accounts for 3,980,007,000 kg of CO2 emissions. This
is equal to 5.5% of Scottish total annual emissions (72,300,000,000 kg).
Electricity use in the home was responsible for around 6% of the Scotland’s carbon dioxide emissions in 2002. With the number of households in Scotland rising from 1.8 – 2.3 million over the last 20 years it is important that careful consideration is given to how electricity use in home can be reduced.
top
--------------------------------------------------------------------------------
[1] 1999/00 Scottish figures
from GROS, SE
Renewable Energy and Carbon Dioxide
Carbon dioxide (CO2) is the main gas produced by human activities, which is implicated in global warming. The UK Government has already undertaken to reduce CO2 levels by 2010 to 20% below what they were in 1990. For the main greenhouse gases together it is committed to a 12.5% reduction against 1990 levels by 2010.
In the big picture, saving energy helps reduce CO2 emissions and cuts greenhouse gases, which in turn reduces global warming. Renewable energy is seen as an ideal way to produce 'clean' electricity that does not produce any CO2 during electricity generation.
Renewable technologies generate electricity without burning fossils fuels and therefore help prevent the emissions of harmful CO2. In the same ways nuclear power generation does not emit CO2 to the atmosphere during power generation, although many people are concerned about the health and safety implications of nuclear power (www.british-energy.co.uk).
As Renewable energies due not produce CO2 whilst the are generating electricity there environmental benefits be calculated. Renewable technologies tend to be intermittent and cannot supply base load as they do not provide a constant power output. Renewable energy is more suited to satisfying intermediate and peak loads and therefore any energy generated offsets electricity production that would have otherwise been generated by fossil fuels. When calculating the benefits of renewable energy in terms of carbon dioxide emissions comparisons are often made with respect to fossil fuel power stations.
In Scotland most Renewable electricity offsets electricity that would have otherwise been produced from coal power stations - example Longannet Power Station, Fife.

From the EMAS report average figures demonstrate that the production of
1 kWh of electricity from a coal-powered fire station produces on 966g of carbon dioxide. Other figures are shown below for coal, oil and gas power stations.
For calculations in the website the figure of 0.97kg will be used to demonstrate
carbon dioxide emission that can be offset by renewable energy.
Traditional Power Station Emissions
The following information compares different fossil fuel stations and their levels of emissions per kWh.

Standby Electricity and Carbon Dioxide
Standby electricity needlessly places extra demand on Scotland's electricity generation production and is also responsible for needlessly polluting the environment - if electricity is produced at fossil fuel stations, carbon dioxide is also being emitted. Click on Standby Electricity if you want to remind yourself of how standby electricity is costing you unnecessary power.
To summarise Standby Electricity, the average household could save somewhere in the region of £10 - £80 by switching appliances off rather than leaving them on standby. The average saving is estimated at £25, although a typical three bedroom flat could save about £37 through these changes.
Switching appliances off correctly can benefit you as an individual due
to financial savings, however these saving may appear relatively low for
one house. Consider the effects that these measures would have across
the whole of Scotland (average £25 per house) = 25 x 2,350,000 =
£58.75 million.
More importantly from an environmental point of view is the large amount of CO2 that is also being produced unnecessarily. 1 kWh of electricity produced from a coal powered station emits 0.97kg of CO2 to the atmosphere.
It is perhaps unreasonable to expect everyone to turn off every appliance in their house, as this can often be a nuisance when they are switched back on and clocks have to be reset, radio station have to be retuned, so we are going to consider a variety of possibilities and see how they effect the amount of CO2 emitted to the atmosphere.
The Standby Electricity section considered the financial effects of standby electricity use. This section is going to consider the environmental effects take on a national scale. A variety of scenarios are illustrated to help demonstrate what could happen if people began to switch off appliances properly. In this way we can see how CO2 emissions can be reduced by bringing down the amount of standby electricity use.
Our first consideration is the most common appliance in houses, the TV and video set. These appliances are rarely switched off correctly and usually just put on standby using the remote control. We will investigate if switching these appliances off after use can save carbon dioxide emissions.
i) Never Off (on standby 365 days year)
TV and Video on standby all year round (365 days) and never switched off
properly.
Would use on average 102.49 kWh / year.
i) Remember there are 2,350,000 households in Scotland. So across Scotland this would be wasting approximately.
102.49 kWh x 2,350,000 houses = 240,851,500 kWh/year
ii) As mentioned earlier 45% of Scotland's electricity is produced from fossil fuels - so figure needs to be adjusted to reflect this.
0.45 x 240,851,500 kWh / year = 108,383,175 kWh/year
iii) For fossil fuels every kWh of electricity produces 0.97 kg of CO2
0.97kg x 108,383,175 kWh/year
= 105,131,679 kg/CO2
Annual CO2 emissions due to leaving TV and Video on Standby.
2.6 % of Household CO2 Emissions (2.6 % of 3,983,250,000 kg)
0.14 % of Total CO2 Emissions (Scottish total = 72,300,000,000 kg)
Perhaps more energy intensive, than the living room example, is the fact that there are an increasing amount of appliances left on standby modes in the kitchen. Most of these appliances have clocks that function when the appliance is not working, and as a result the appliances are left on all the time.
These will also have an effect on the carbon dioxide emissions in Scotland
ii) Never Off (on standby 365 days year)
Kitchen appliances on standby all year round (365 days) and never switched
off properly.
Would use on average 226.43 kWh / year.
i) So across Scotland this would be wasting approximately.
226.43 kWh x 2,350,000 houses = 532,110,500 kWh/year
ii) Assuming 45% could be generated from fossil fuels.
0.45 x 532,110,500 kWh / year = 239,449,725 kWh/year
iii) For fossil fuels every kWh of electricity produces 0.97 kg of CO2
0.97kg x 239,449,725 kWh/year = 232,266,233 kg/CO2
Annual CO2 emissions due to leaving a selection of kitchen appliances on standby.
5.8 % of Household CO2 Emissions (5.8 % of 3,983,250,000 kg)
0.32 % of Total CO2 Emissions (Scottish total = 72,300,000,000 kg)
In their bedrooms, most people have a radio alarm clock, a portable stereo and perhaps a TV, whilst many more have computers and associated equipment - speakers, scanners, external disk drives. For this example we will just consider the three most common appliances radio alarm clock, a portable stereo and TV standby. We will however assume that there is an average of two bedrooms per house to help establish the effects on the carbon dioxide emissions in Scotland
iii) Never Off (on standby 365 days year)
Bedroom appliances on standby all year round (365 days) and never switched off properly.
Would use on average 75.34 kWh / year.
Assume 2 bedrooms per household.
i) So across Scotland this would be wasting approximately.
(75.34 x 2) kWh x 2,350,000 houses = 354,098,000 kWh/year
ii) Assuming 45% could be generated from fossil fuels.
0.45 x 354,098,000 kWh / year = 159,344,100 kWh/year
iii) For fossil fuels every kWh of electricity produces 0.97 kg of CO2
0.97kg x 159,344,100 kWh/year = 154,563,777 kg/CO2
Annual CO2 emissions due to bedroom appliances left on Standby.
3.8 % of Household CO2 Emissions (3.8 % of 3,983,250,000 kg)
0.21 % of Total CO2 Emissions (Scottish total = 72,300,000,000 kg)
There are very few electrical appliances in the bathroom for obvious reasons, however there is an increase in the amount of electric toothbrushes and shavers that are often left on unnecessarily.
iv) Never Off (on standby 365 days year)
Bedroom appliances on standby all year round (365 days) and never switched
off properly.
Would use on average 15.77 kWh / year.
i) So across Scotland this would be wasting approximately.
15.77 kWh x 2,350,000 houses = 37,059,500 kWh/year
ii) Assuming 45% could be generated from fossil fuels.
0.45 x 37,059,500 kWh / year = 16,676,775 kWh/year
iii) For fossil fuels every kWh of electricity produces 0.97 kg of CO2
0.97kg x 16,676,775 kWh/year = 16,176,471 kg/CO2
Annual CO2 emissions due to bathroom appliances left on Standby.
0.4 % of Household CO2 Emissions (0.4 % of 3,983,250,000 kg)
0.02 % of Total CO2 Emissions (Scottish total = 72,300,000,000 kg)
Using the above examples the average standby power figures in Scotland;
Living Room 108,383,175
kWh/year
Kitchen 239,449,725 kWh/year
Bedroom (2 no.) 159,344,100 kWh/year
Bathroom 16,676,775 kWh/year
Total 525,853,775 kWh/year
Whilst on standby these appliances use the equivalent electricity of 525 GWh a year. This is 1.6% of Scotland's total yearly electricity production. Switching these appliances 'off' correctly would prevent the emission of 510,078,161 kg/CO2, which is 0.7% of Scottish Carbon Dioxide Emissions Total
From the graph you can see that a 0.7% reduction makes very little difference to Scotland's CO2 emissions total. N.B the y-axis of the graph does not begin at zero so that you can see a separation of the two lines rather than one on top of the other - which is how 0.7% looks on a full graph as the difference is so small.
Total of household consumption
Think about the consequences of your acts. In little acts like this, we
are avoiding tonnes of CO2 emissions.
top
![]()
Home, Beginners Guides, Urban, Standby, Cutting the cost, Consumption Guides
![]()