Resource
|
|
|
Click the Button to go back to Demand |
|
|
Click the Button to go to Demand Side Reduction |
Contents
Wind
General Information on
Wind Power
Wind energy stands out to be one of the most
promising sources of electrical power. With the price of production from wind
turbine falling dramatically over the last 30 year to achieve now a remarkable
4p/kWh, many countries in the world promote wind power technology and European
countries are no exception to that rule. For example, the UK’s Non Fossil Fuel
Obligation program will add 500 MW of wind power to the UK’s power grid by
2010.
Wind turbines capture the wind’s kinetic energy
in a rotor consisting of 3 blades mechanically coupled with an electrical
generator. The turbine is mounted on a tall tower to enhance the energy
capture. Numerous wind turbines can be installed on one site to form a wind
farm of the desired energy production. Most modern wind turbines use
horizontal-axis up-wind design.
The power extracted by the wind is given by the
formulae: P = 0.5 * Cp * r * A * V3
With Cp: Capacity Factor between 0.2 and 0.4
r: Air Density r=1.225kg/m3 at sea level,
atmospheric pressure and 15°C
A:
Rotor Swept Area in m2 A=p*D2/4 with D the rotor
diameter
V:
wind Speed in m/s
Reasons for Large turbines
Economy of Scale:
Large machines deliver more electricity at
lower cost since the cost of foundations, road building, electrical grid
connection are basically the same and besides the number of components inside
the turbine are independent of the size of the machine.
Larger Turbines are well suited for offshore:
The cost of foundation does not rise in
proportion to the size of the machine, neither do the maintenance cost.
Efficiency:
Large turbines use existing wind more
efficiently.
Reasons for Small Turbines
Local Grid Too Weak:
This is the case for remote parts of electrical
grid with low population density and little electricity consumption.
Less Fluctuation in the Electric Output:
The fluctuation of the electricity output from
a wind farm with smaller turbines are less likely to reach high values. As if
the wind is not blowing on one turbine it is very likely to blow on a large
proportion of the rest of the turbines.
Spread the risk of Momentary Failure:
E.g. if one turbine is struck by lightning.
Cost of Using Large Cranes:
In case of large machine, the road building has
to be strong enough to support the weight of the cranes as well as the weight
of the elements that make the turbine.
Location


Situated at a height of around 300 m
on an unobstructed terrain, the site is ideal for wind. Both the British Wind
Energy Association (BWEA) and the Meteorological Office (MET Office) give us an
annual average wind speed of about 8 m/s. We also understand that the Argyll
and Bute Council has carried a survey to determine the areas of sensitive,
preferred and intermediate preferences for the implementation of wind farms.
The chosen site is actually in an area of preferred preferences.
Wind Speed Profile
The data
available from the MET Office was a 10-minute average wind speed measured at
09:00 every morning and hence we felt it would be more appropriate and accurate
to work with the monthly averages. This fact explains the stepwise form of the
annual production of the turbine.
Selection
of the Turbine
Because a
cluster of three turbines is not considered to be wind farm according to the
Argyll and Bute Council planning guidelines, we decided to limit the number of
turbines on the site to three. And therefore after investigating a number of
different wind turbines, we chose the Nordex 600 kW.
Below are
the Nordex N43/600 kW manufacturer’s specifications:
Rotor Data:
|
Type |
3 bladed, horizontal axis, upwind |
|
Rotor Diameter |
43m |
|
Swept Area |
1.452
m2 |
|
Power Generation |
Stall |
|
RPM |
27.2/18.1
rpm |
|
Cut-in/cut-out Wind Speed |
3-4/25
m/s |
|
Rated Wind Speed |
13.5
m/s |
|
Calculated Lifetime |
20
years |
Power
Curve:
Annual
Production
The
manufacturer predicts an annual production of approximately 1.8 GWh per annum
for an annual average wind speed of 8 m/s.
Hydro-Scheme
General Information on Small-Scale Hydro
Small
hydropower, with its multiple advantages as a decentralized, low-cost and
reliable form of energy, is in the forefront of many countries' programs to
achieve energy self-efficiency. Small hydro allows for rural electrification,
petroleum substitution, rural development of isolated communities and as well
as creation of employment. Hydro is a well-established technology and there is
vast potential for small-scale deployment worldwide.
Investments
in small scale hydro was rendered uneconomic in the 1950's by the availability
of cheaper electricity through an expanding, province-wide grid; and by the
availability of portable, flexible, low cost diesel generators. Diesel
generators are still cheap to buy - but the rise in the cost of oil has made
them expensive to operate. In most cases the national electrical grid, while
extensive, do not include a number of small communities, resource-based
businesses, farmers, and lodge owners.
Now
things have changed – small-scale hydro has become economical attractive
because it offers a stable, inflation-proof source of electricity, using proven
technology. Small hydro installations have, historically, been cheap to run but
expensive to build. That is changing now, with smaller, lighter, and higher
speed turbine equipment, lower cost electronic speed and load control systems,
and inexpensive plastic piping. Capital investments are still higher than
investing in diesel equipment of comparable capacity; but the long life and low
operating costs of small hydro make it an attractive investment for many
applications.
Costs
for small hydro installations vary considerably, because sites, conditions and
sizes are all different. In establishing hydro installations the following
factors, but not limited to, have to be taken into account:
(a)
Estimate the power you need;
(b)
Estimate the stream flow
available;
(c)
Measure or estimate the head
available on the stream;
(d)
Estimate the power and energy
available from the stream;
Points necessary for Hydro Electric Power (HEP)Schemes:
- A high
rainfall catchment area
- A river
or water source with a suitable head of water
- A water
intake placed within a weir or a dam
- A method
of transporting this water to the turbine, through a pipe or channel
- A
turbine, generator, and electrical grid connection
- The
return of its water to the main flow
The exploitation of HEP schemes
is dependent upon the topography, rainfall and the availability of funds, as a
large capital outlay is initially needed. It is necessary to assess the visual
intrusion upon the landscape and any changes to the local ecology that may be
made. Very small schemes may use relatively cheap and very reliable electronic
load control systems.
Types
of turbines
Low, medium
and high head are terms used to indicate the most suitable type of turbine for
hydro projects. The various types of turbines are listed below:
- Low Head up to 10 m Use: Cross-flow, axial-flow or
propeller turbine
- Medium Head 10 m to 200 m Use: Cross-flow, Francis,
Pelton or Turgo turbine
-
High Head 200 m to 1000 m
Use: Pelton, Turgo-impulse or Francis turbine
Small
Hydro System Components
Power House
The powerhouse stores and protects all the
power-producing equipment and control devices. These devices can be operated
and monitored either on site or remotely.
Feeder Canal
Water flows down the feeder canal from the intake
to the forebay .The canal is usually made of earth or concrete, and is fitted
with a grating to keep out solid objects carried by the stream.
Penstock
The penstock is a pipe connecting the forebay to
the powerhouse. It pressurizes the water and must be capable of withstanding
high pressures, and is therefore usually made of steel
Forebay
The forebay is a tank that holds water between the
feeder canal and the penstock. It must be deep enough to ensure that penstock
inlet is completely submerged so that air is excluded from the power equipment.
Tail Race
The tailrace is the flow of water out of the
powerhouse back into the stream.
Reserve Flow
Hydroelectric plants are designed to use only part
of the total water flow under normal operating conditions. The reserve flow is
the portion of the flow not normally used
Intake
The intake is a buffer between the water supply and
the hydroelectric plant. It is constructed of earth, masonry or concrete. Its
shape is largely determined by the nature of the terrain.
Fish Ladder
The fish ladder allows migratory fish to move
upstream to minimize the biological impact of the power plant.
Hydro Energy Production Equipment
Turbine
A hydraulic turbine is a rotating machine driven by
water under pressure from a penstock or forebay. The energy in the flowing
water is converted to mechanical energy by a revolving wheel fitted with blades
buckets or vanes.
The flow is directed at the wheel by a nozzle or an
injector allowing the flow to be adapted to the mechanical power required by
the electrical equipment being driven.
Controls
Generators must conform to characteristics of the
electrical equipment they are powering. Control systems act to modify the water
flow to the turbine to maintain the desired characteristics, or to dissipate
excess energy.
Set up Gearing
Electric generators are more efficient when they
run at high speeds. If a turbine rotates at a low speed, "stem-up"
gearing can be installed between the turbine and the power generator to
increase the rotation speed.
Generator
Generators convert the mechanical energy produced
by the turbine into electrical energy. Different types of generators are used
depending on the characteristics of the electrical grid the hydroelectric
systems are connected to.
Assessment of hydro potential at Lochgilphead
Through
a site visit undertaken to Lochgilphead and the use of a map (Landranger 55)
three potential sites for deployment small scale hydro were identified:
1.
Dippin Burn stream which
flows through the village
2.
River Add, which is about 6
km from the village and flowing westwards towards the ocean
3.
The Crinan canal – a 10 km
long canal joining the coast and Lochgilphead.
However,
after further consultations and investigations the Dippin Burn and the Crinan
canal were abandoned due to low flow rates and stringent water rights
respectively.
Location

Rainfall data
The
rainfall data was sourced from Websites of the Centre for Ecology and Hydrology
and the Meteorological Office (U.K). Below are tabulated average annual
rainfall statistics for the chosen site.
|
Month |
River Add |
|
Average Annual Rainfall (mm) |
|
|
Jan |
169 |
|
Feb |
106 |
|
March |
139 |
|
April |
81 |
|
May |
83 |
|
June |
92 |
|
July |
114 |
|
August |
132 |
|
September |
181 |
|
October |
194 |
|
November |
175 |
|
December |
167 |
Table 1. Showing the average annual rainfall for the site
Geology
Most of
the Argyll and Bute area is formed of Dalrian rock. The township of
Lochgilphead is built on a rock composed of alluvium and raised marine
deposits.
Hydrology and Geography
Rainfall
on the catchment area is important for the operational fie of a hydro scheme.
The rain falling on the catchment area, the greater will be the river or burn
flow, the greater the amount of power will be generated.
The
catchment areas were estimated and with the knowledge of the monthly rainfall
for the sites, as well as the evaporation and transpiration (E and T), which
was estimated, to be 30%, the monthly run-offs were calculated. Most of the
area is hilly and covered with forest.
Run –off and average annual flow of the River Add
The run-off of the Crinan canal
was not determined because during the preliminary assessment it was found that
canal is that is almost stagnant and the water usage (e.g. shipping). Hence, it
was abandoned. The run-off and the annual flow of the Dippin Burn were
determined in a similar way for the river and found to be low. Because of the
low flows as shown in table 2, it was decided to abandon the burn.
With
the help of the map, the catchment areas for the sites were estimated to be
10.9 km2 and 71.2 km2 for the stream and river
respectively. From the rainfall and the catchment area, using the catchment
boundary area method, the average monthly flow were estimated and consequently
the turbine flow. To estimated the turbine flow, it was assumed that 10% of the
run-off is residual. Evapo-transpiration losses were assumed to be 30%. To
calculate the power output, turbine –generator efficiency was taken to be 80 %.
The net head was estimated to be 10 m. The power output is calculated as
follows: P = gQH (kW), where g = 9.81, Q is the turbine flow and H is the
effective head.
|
Month |
Stream Flow (m3/s) |
Residual Flow (m3/s) |
Turbine Flow (m3/s) |
Turbine & Generator Power Output (kW) |
|
|
||||
|
Jan |
0.51 |
0.051 |
0.459 |
36.02 |
|
Feb |
0.32 |
0.032 |
0.288 |
22.60 |
|
March |
0.42 |
0.042 |
0.378 |
29.67 |
|
April |
0.24 |
0.024 |
0.216 |
16.95 |
|
May |
0.25 |
0.025 |
0.225 |
17.66 |
|
June |
0.27 |
0.027 |
0.243 |
19.07 |
|
July |
0.34 |
0.034 |
0.306 |
24.01 |
|
August |
0.4 |
0.04 |
0.36 |
28.25 |
|
September |
0.51 |
0.051 |
0.459 |
36.02 |
|
October |
0.58 |
0.058 |
0.522 |
40.97 |
|
November |
0.53 |
0.053 |
0.477 |
37.43 |
|
December |
0.51 |
0.051 |
0.459 |
36.02 |
|
Average Power (kW) |
|
|
|
26.51 |
|
Average annual energy output (kWh) |
|
|
|
232227.6 |
Table 2. Showing average annual stream flows and turbine flow for the Dippin Burn
|
Month |
Stream
Flow (m3/s) |
Residual
Flow (m3/s) |
Turbine
Flow (m3/s) |
Average
Power output (kW) |
|
Jan |
3.14 |
0.314 |
2.83 |
222 |
|
Feb |
2.11 |
0.211 |
1.90 |
149 |
|
March |
2.59 |
0.259 |
2.33 |
183 |
|
April |
1.56 |
0.156 |
1.40 |
110 |
|
May |
1.54 |
0.154 |
1.39 |
109 |
|
June |
1.77 |
0.177 |
1.59 |
125 |
|
July |
2.12 |
0.212 |
1.91 |
150 |
|
August |
2.46 |
0.246 |
2.21 |
173 |
|
September |
3.48 |
0.348 |
3.13 |
246 |
|
October |
3.61 |
0.361 |
3.25 |
255 |
|
November |
3.36 |
0.336 |
3.02 |
237 |
|
December |
3.11 |
0.311 |
2.80 |
220 |
|
Average
Power (kW) |
|
|
|
182 |
|
Average
Annual Energy output (kWh) |
|
|
|
1 594 320 |
Table 3.Showing average annual stream flows and turbine
flow: - River Add
Fig.1 Flow characteristics of the
River Add
Fig.2 Power characteristics of the
River Add
Site selection and its characteristics parameters
The
River Add was chosen because of its higher flow rates. However, it must be
pointed out that to get much more accurate results flow measurement should be recorded
for a longer period of ten years. The figures presented below are estimates.
Table 4 Summary of parameters of the River Add
|
Parameter |
River
Add |
|
Head
(m) |
10 |
|
Minimum
flow (m3/s) |
1.40 |
|
Maximum
flow (m3/s) |
3.25 |
|
Minimum
Power (kW) |
109 |
|
Maximum
Power (kW) |
255 |
|
Overall
efficiency (%) |
0.8 |
Turbine selection
Because of low head
and low flow, a cross-flow turbine would be the most appropriate choice. Based on
the head and the minimum flow rate, a 100 kW turbine was chosen. This will
provide an annual energy of 1 594 320kWh.
Electric generators are more efficient when they run at high speeds. As the
turbine would rotate at a low speed, a "stem-up" gearing could be
installed between the turbine and the power generator to increase the rotation
speed.
Costing of the system
The costing of the
system was based on rates provided by the Small hydropower. The overall cost of
the system was estimated to be £225
825.00.
Biomass
Energy From Willow
Site selection
Moisture.
Willows grow best where there is at least 600 mm of rainfall, distributed evenly through the growing season, and moisture available within about one metre of the surface. Willow can grow on land that is too wet for other crops, but areas liable to winter flooding are unsuitable for mechanical harvesting.
Soil type.
Most agricultural soils with pH in the range 5.5 - 7.5 can be used for willow production. Conventional planting methods require 200 - 300 mm depth of cultivated soil. Dry limestone and chalk areas are not suitable. Heavy clays tend to be cold in spring and this results in slow establishment. Weed control can be a problem on organic soils, because very few suitable herbicides are available.
Temperature.
Willow can tolerate very low temperatures in winter, but frost in late spring, summer or early autumn will damage the top shoots. Valley bottoms are often frost pockets. Spring and autumn frosts limit the extent of willow plantations to the north more than does the length of the growing season.
Steep slopes.
Steep slopes can lead to problems with soil erosion. Harvesting machinery may have difficulty working on slopes greater than about 15%.
Overhead power cables
These must be
considered, because willow could reach a height of 7 m before it is
harvested.
Site Layout
Layout should be optimised to maximise the volume of willow planted per hectare. Typically 9000kg of dry willow can be obtained per hectare.
Harvesting techniques
Types of harvesting system
|
|
|
Harvest and chip in one
operation |
Most developed and
cheapest system at present, but long term storage may involve costly drying
to prevent mould growth |
|
Harvest full length sticks,
to be chipped later |
Equipment needs further
development, but storage likely to be easier |
|
Gather sticks into bundles
or bales during harvest |
|
Willow harvesting is normally restricted to the
winter months (November -February in northern Europe) in the period after leaf
fall and before leaf set. An extended harvest period of late September to June
is possible, but may lead to:
·
higher
moisture content at harvest;
·
blockage of
harvesters by leaf material;
·
problems of
contamination within the energy conversion equipment;
·
reduction
in long-term yield, as nutrients in leaves are not returned to the soil;
·
reduced
biodiversity.
Willow for energy production has generally been harvested on a three-year cycle. Harvesting on a 2-year, 4-year or 5-year cycle can be considered, depending on the rate of crop growth and the demand for fuel. Stem thickness influences the type and quality of fuel produced: shorter harvesting cycles will produce thinner stems, with a high proportion of bark.

Drying and storage
Freshly harvested willow contains over 50% moisture
material. Willow sticks dry naturally during storage. Under typical European
conditions the moisture content will eventually fall to 15 - 25%
unless the material is re-wetted by rain. Heaps of sticks are sufficiently
permeable to allow cooling by natural convection. Bundles or bales of willow sticks could probably be
stored without major deterioration
Stacks of wet chips quickly heat up and start to decompose. Temperatures of 60° C can be reached within hours. Much of the energy value may be lost, and mould spores are a health hazard. This is a major issue for cut-and-chip harvesting systems. Storage characteristics of billets are intermediate between those of sticks and chips. Chips can be dried successfully, and then stored with little further loss of dry matter. Grain drying techniques have been adapted for willow chips, though the material is less dense than grain and does not flow so readily.

High temperature rotary driers are an option for large-scale operations, but not generally economic for individual farms. Most continuous grain driers can only work with flowable materials, though the conveyor type may be adaptable for willow chips. Volatile components can create atmospheric pollution in the form of "blue haze" where wood fuel is dried at temperatures above 100° C. Low rate aeration can be used to minimise moulding and dry matter loss from a stack of wet chips, built over a simple perforated duct fitted with a small fan. Airtight storage can greatly reduce dry matter losses, but commercial scale methods have not yet been developed.
Density of willow fuel is low, therefore large volumes have to be stored. Many farms have suitable areas available, but storing large quantities at a power station may be impractical. Chipping after harvest
Freshly harvested willow can be chipped using less energy than sticks that have dried during storage.
If sticks are chipped in a separate operation, a large static machine at the power plant will probably be more economical than either small individual chippers on farms or a larger mobile chipper moved from site to site.
Cost Information
Assumptions
The willow
costs are linked to the overall plant-sizing sheet through the PRIMA
software. The assumptions for the
costings are given below. The cost
information was provided by the Scottish Agricultural College, a document that
is referenced in the overall financial assumptions sheet.
·
Growing
costs are 33% of total costs
·
Harvesting
costs are 33% of total costs
·
Transportation
and Drying Costs are 33% of total costs
·
9000 kg
harvested per hectare on a 3 yearly cycle
·
Establishment
costs can be capitalized
|
|
£ Per Ha |
|
|
|
Cost of Cuttings |
1,500 |
|
|
|
Ground Preparation |
300 |
|
|
|
Fencing |
400 |
|
|
|
Weed Control |
150 |
|
|
|
Management |
230 |
|
|
|
Total - Year 1 |
2,580 |
|
|
|
Total - Year 2 |
380 |
|
|
|
Total - Year 3 |
380 |
|
|
|
Capital Cost |
3,340 |
|
|
|
Operating Cost (pa) |
6,680 |
|
|
|
|
|
|
|
|
Fuel Consumption - SRC (kg/kWh) |
0.235 |
|
|
|
Fuel Cost - SRC - (£/kg) |
0.104 |
|
|
|
|
|
Availability |
Electrical Output (kWh) |
|
Size of CHP Unit 1 (MW) |
2.3 |
0.95 |
2,871,090 |
|
Size of CHP Unit 2 (MW) |
2.2 |
0.58 |
1,676,664 |
|
|
|
|
|
|
Energy From MSW (kWh) |
1,560,000 |
|
|
|
Energy from forestry
Residue (kWh) |
466,000 |
|
|
|
|
|
|
|
|
Total Electrical Output
(kWh) |
2,521,754 |
|
|
|
|
|
|
|
|
Weight
of Willow Required (kg) |
592,612 |
|
|
|
Size
of Willow Plantation (ha) |
66 |
|
|
|
Capital
Cost of Willow (£) |
219,925 |
|
|
|
Operating
Cost of Willow (£) |
439,850 |
|
|
CHP and District Heating – Technology Review
Introduction
The development of Community heating schemes offers significant opportunity for supplying affordable warmth to residents, for delivering energy efficiency to a wide range of clients and for reducing greenhouse gas emissions. It is an extremely flexible energy supply system because virtually any fuel can be used and production from a wide variety of plants can be utilised in the same network. This is important in maximises security of supply given future fuel scenarios.
Description of CHP
Current methods of producing electricity from thermal source (fossil or ‘renewable’) are largely based around gas turbine, steam turbine or combined cycle gas turbine. In the latter case some of the heat used during production of the high pressure gas is collected and used to raise steam to drive a steam turbine. The efficiencies of these systems have a theoretical maximum of around 60% and currently run at no better than 55%.
Much of the electricity produced from these largely in-efficient methods is used in buildings for space heating – approximately 30% in the UK. Space heating represents an extremely low grade of power requirement. From a domestic perspective, temperatures of 15-18 degrees in living rooms and 18-21 degrees in bedroom represent typical comfort levels. Using electricity as the energy source to deliver these temperatures represents an extremely inefficient use of a precise energy source.
CHP units reclaim almost all of the heat used in producing the electricity to heat water to 90-120 degrees. This hot water can then be used in domestic heating schemes to generate space-heating requirements for domestic, commercial and industrial use. As a result CHP units typically run at 85% efficiency and therefore represent a far more responsible use of energy than their alternatives. This is illustrated in Figure 1.
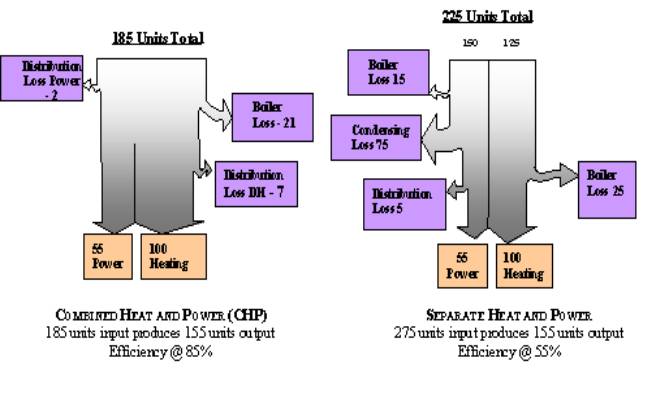
Figure 1: Comparison between separate heat and power production and CHP
The operating costs of a CHP plant are very low dependant on fuel source, however the capital costs are very high and are related to matching peak demands. It is important therefore that the emphasis of any demand side reduction techniques employed should be to reduce peak demands rather than reducing overall heat consumption. Typically, the heat output from the CHP plant could be used to meet 50% of the peak load.
Choice of System Temperatures
The selection of the temperature parameters of the system has major implications for the overall economy of the CHP system. The fundamental design parameters to be considered are:
· Flow and return temperatures supplied to the buildings at design conditions and at part load.
· Flow temperature at design conditions produced at the CHP heat generating plant
· Flow temperature at design load conditions at furthest customer
· Temperature control by consumers
· Minimum acceptable flow temperature at minimum flow condition
It is important that maximum use of the hot water temperature is made i.e. that the return temperature be low. This is important for overall economics of the system affecting transmission capacity utilisation, pumping costs and CHP power production.
An acceptable maximum flow temperature entering a dwelling is 90°C. Internal heating systems in the UK are designed for 82/71°C (flow and return). This is to minimise the size of radiators. The resulting mean temperature of 76°C is a major constraint on CHP system design. Converting a system to 90/60°C is feasible providing the re-balancing of the secondary side systems can be achieved. Basically it means that the radiators have to be bigger. However, if the building fabric is also upgraded then a mean temperature of 65 (80/50)°C could be delivered – this would require a reduction in heat losses from the building of 25%.
The supply temperature should not be reduced below the level required to provide an adequate source of hot water from storage facility and also ensure that stored water can be maintained above 60°C for legionella control. This effectively sets a lower limit of flow temperature at 70°C.
Selecting low temperatures for distribution will improve the efficiency of electricity production and reduce mains losses. However, if as a result the temperature drop through the system is reduced then the volume of water required is greater and mains and pumping costs are increased.
Common Design Temperature Levels
1. Medium temperature is up to 120°C and 16bar for large CHP systems with high static pressure usually with indirect consumer connection.
The cost of community heating
network for large scale CHP tends to dominate the overall optimisation. Ensuring that the differential between peak
design flow and return temperatures is as large as practible reduces both
capital and running costs. A figure of
50°C is attainable.
It is common practice in large
citywide CHP systems to use a peak design temperature of 120°C but to vary the supply temperature according to the
ambient conditions using as low a supply temperature as possible to meet
customer requirements.
2. Low temperature and low-pressure systems are favoured where the
connections are predominantly individual houses. Direct connection of each dwelling to the network will be the
lowest cost option but the flow temperature will then be constrained to 90°C and the pressure to 6 bars (if plastic pipe is
used).
With existing UK specified
radiator building fabric design the temperature would be 90/60°C. If
improvements to building fabric could be made then 80/50°C or lower could be used.
If steam turbine CHP plant is
applying the scheme then reducing the differential between flow temperature and
outside air temperature will be economic.
Optimisation of Flow Pressure
Variable flow with variable
speed pumping is the most economic CHP distribution.
With plastic pipes the maximum
pressure, which can be used, is 6 bars.
Older radiators have been tested
to 4.4 bars only. Modern radiators have
been tested to between 6 and 10 bar. 6 bars is acceptable for small schemes
where there is not a ferocious requirement to pump the water up either big
hills or tall buildings or if long transmission lines are not proposed.
Summary
The most cost effective heat
distribution method for large-scale CHP systems is medium hot water designed
for a large temperature drop.
The underground pre-insulated
steel pipes will be designed for 16 bars and 120°C according to EN253.
Large building will be connected
indirectly to the CHP network.
For housing, a heat exchanger
substation supplying a number of houses in a terrace will be more economic.
Lochgilphead CHP Technology
Steam turbines were considered
for this project for the following reasons:
They can take any type of
fuel. Gas turbines require the gaseous
products of the combustion to be relatively pure. This would be the case if the project were only using willow as a
fuel source. However, it is more
economical to use waste material as part of the fuel source.
Highly reliable – 99%
Variable heat:power ratio
dependant on the pressure of steam exiting the turbine. As the CHP plant is being sized to meet a particular
demand, this means that the ratio can be altered to provide some degree of
seasonal adjustment. The ratio of
usable heat to power in a steam turbine CHP set is unilikely to be less than
3:1 and may be 10:1 or more
Back Pressure Steam Turbine
Simple backpressure sets, using
hot water as the primary heat distribution medium, can expand to low pressures
and temperatures to give a good balance between power and heat output.
Lower backpressures can be used
in the summer when CH flow temperatures can be reduced. This gives higher efficiency electricity
production.
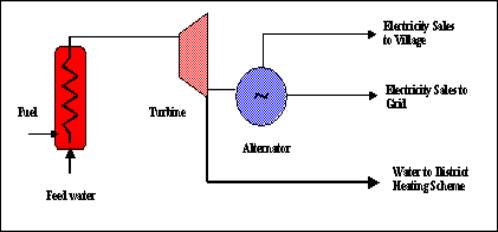
![]() Schematic
of a Backpressure Steam CHP Unit
Schematic
of a Backpressure Steam CHP Unit
Optimisation of Steam Turbine
The quantity of electricity
produced by the steam turbine depends upon the temperature at which steam is
exhausted from the turbine. The lower
the exhaust steam temperature the more efficient the turbine. High-efficiency turbines exhaust at near
vacuum conditions that is obviously of no use if you subsequently want to use
the water in a DHS. In order to
distribute and use reject heat effectively
The water/steam temperature has
to be exhausted at 75/120°C. Consequently to maximise electricity
production the flow and return temperatures should be kept as low as possible.
A small temperature drop will
result in higher cost of pipe network
Fuel Types considered in the Project
|
Fuel Type |
Energy Derived MJ/kg) |
Contribution |
Problems |
|
Willow |
17.02 |
55% |
Capital Intensive No return in first 3
years Competition for land use
Visual impact |
|
MSW |
10.06 |
33% |
Handling Storage |
|
Forestry Residue |
18.9 |
17% |
Current logging methods Handling Storage |
Agricultural waste was not
considered, as the data was not available at time of press. Safe to say that the system could accept
dried slurry from dairy cow farming practices.
There are 600 dairy cows in Argyll so there is potential for the amount
of Willow required to be reduced even further.
Current logging practice uses
the residue as brash mats for removing the ‘useful’ timber. This would render the residue useless. The forestry industry would have to adopt
Scandinavian logging practice where the residue is treated with the same care
as the ‘useful’ timber. Studies have
shown no ill effects of removal of the timber that would normally rot back to
the soil. The presence of the stump
provides enough organic retrieval for the soil conditions not to be impaired.
Lochgilphead District Heating Scheme
The length of network was
estimated at 7km assuming the CHP units were located within the boundaries of
the village.
The costs are based on the
following assumptions:
The pipe size was 150mm
diameter, pre-insulated steel pipes designed for 16 bars and 120°C according to EN253.
The cost depends on the size, rock, services encountered, and
difficulty with traffic, number of valves bends etc.
In a road, £300 per metre of
pipe was allowed. This is for both pipes.
House connection costs were taken
to be £2,500 per household based on the average achieved in Shetland
Total cost of the system is
therefore taken to be (7000m x £300)+(904 Households x £2,500). This comes to £4.36m.
Solar
General Information
In a conventional hot water
system, the water is usually heated by a boiler, burner or electric immersion
heater. A solar hot water system
uses solar energy to heat water, with auxiliary heating provided by a
conventional system. Solar energy is captured and transferred to the water in a
collector, and stored in an insulated hot water cylinder until is required.
Solar water system
for a home

A high-pressure hot water pump attached to a hot water storage tank supplies hot water quickly and at high volume. This makes the system appropriate for showers. The system automatically switches between the solar hot water supply and the boiler to provide an economic, low energy consumption hot water supply. There is no need for the customer to make complex adjustments.
1. Solar heat collector
2. Hot water storage tank (heat exchanger, internal high pressure pump)
3. Hot water supply (boiler)
4. Remote control with water temperature display, used to set the temperature at which the system switches from the solar water supply to the boiler.
Lochgilphead Solar Collector Information
Resource
Demand
· Total Annual energy water heating demand = 2,143 GWh
· Mean Daily Demand
· 1 person (336 houses) = 5.12 kWh
· 2 persons (250 houses) = 6.145 kWh
· 4 persons (364 houses) = 7.168 kWh
Supply
· Designed to supply 100% of the energy for the best month
· The auxiliary resource is electricity.
· Annual system efficiency 40%
· Annual energy from Solar Heater = 1282.3 MWh
· Annual energy from electricity = 859.9 MWh
· To supply the above solar demand it would be necessary 2690 m2 of solar heat collectors.
Economics
Mean Price of m2 is £350
Total price of the installation 2690*350= £941500
Annual generation 1282300 kWh *0.08=£102584
Simple pay-back = 941500/102584=9.18 years
CONCLUSIONS
The installation of solar collectors for water heating is expensive and is only efficient during the summer when the needs of hot water are less. All this with the scarce solar resource due to the latitude and the weather makes the solar collector use not a good decision.