Software and Applications Included in ESPr
ESP-r is distributed under the GPL license and there are no additional licenses required for its use. All the programs described in this page come with in-built help (manuals). Just type:
prj
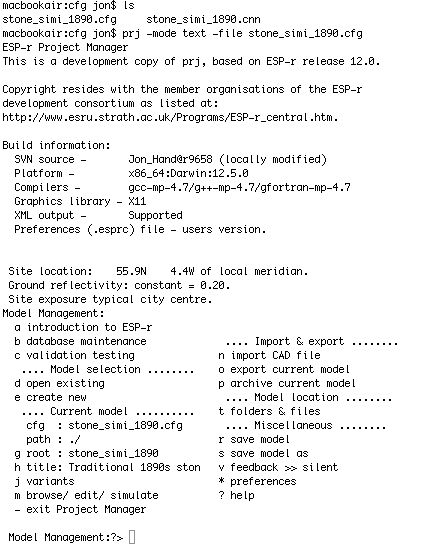
prj or project manager is the core application for managing databases, defining the form and composition of zones, defining what is happening within zones and environmental controls as well as setting up the parameters of assessments to be run. It is probably easiest to start your experiments with prj before using the script or text modes of any subprogram.
The project manager invokes other tools as required to increase the resolution of the model (e.g., pre-calculate shading and view factors), invoke the simulator (bps) and results extractor (res). The interface and primary features are shown here. Some example command line arguments are as follows:
- Start prj with a specific model configuration file.
$ prj -file <config_file.cfg>
- Rotate the model 12 degrees around the point 2.0 4.0 and
update dependencies.
prj -file <config_file.cfg> -act rotate 12.0 2.0 4.0
Modes of interaction
Each ESP-r module can be invoked with a graphical interface, in text mode, or in script mode. Script mode facilitates the use of automation scripts. The graphical and text modes allow for user interaction. An example usage of text mode would be access to ESP-r instances running on servers. The menus and options are consistent across all modes. In the figure below the project manager has been invoked in text mode and focused on a specific model.
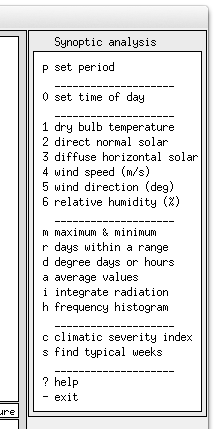
clm
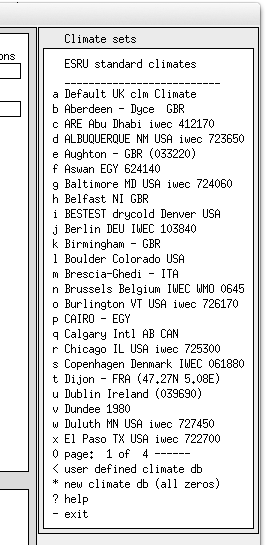
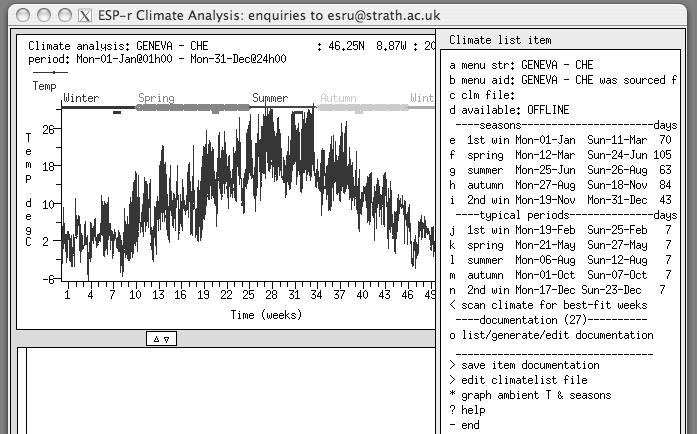
clm is a weather display, analysis, and conversion tool. It may be used to carry out file conversions and explore weather patterns. It can also identify representative periods in each season. Keep in mind, however, that the software itself is not "intelligent", and good pattern matching skills are helpful. The interface and primary features are shown here. It takes the following command line arguments:
- Start it with a specific file
$ clm -file <weather_file_name>
- Convert weather file from binary to ascii
$ clm -file <bin_wthr_file> -act bin2asci silent <file_name.ascii>
- Reverse conversion $ clm -file <new_file> -act asci2bin silent <ascii_file.ascii>
- Convert EPW file $ clm -file <new_file> -act epw2bin silent <wthr_file.epw>
bps
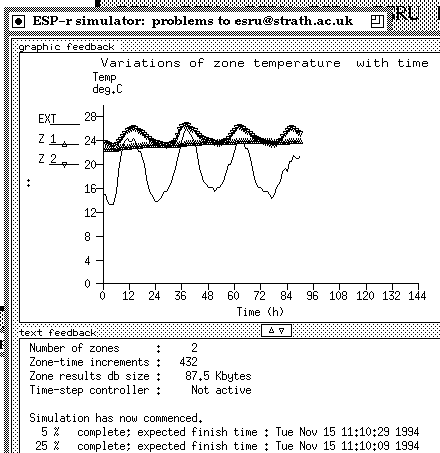
bps is an integrated (all domain) simulation engine which can be run interactively or silently via command line options. Depending on the number of domains implied by the model, separate domain performance files are generated. Monitoring of the assessments can be tracked as they proceed (see below). bps is typically invoked from the ESP-r Project Manager (prj), which is also tasked with setting up most of its directives.
- Run a pre-defined assessment based on a specific model configuration file:
$ bps -file <config_file.cfg> -p winter silent
- Switche to verbose mode to identify warnings:
$ bps -file <config_file.cfg> -vv
- Force text mode interaction
$ bps -mode text -file <config_file.cfg>
cdb
cdb is a database manager for graphic plant descriptions. It follows a similar pattern to enet. It is a work in progress and aims to support electrical networks in the future.
dfs
dfs is a stand-alone Computational Fluid Dynamics (CFD) engine to solve CFD domains where static boundary conditions are applicable and to test whether a domain can be solved. It includes facilities to review domain gridding and to present the results of a CFD assessment. For example, invoke dfs with:
dfv
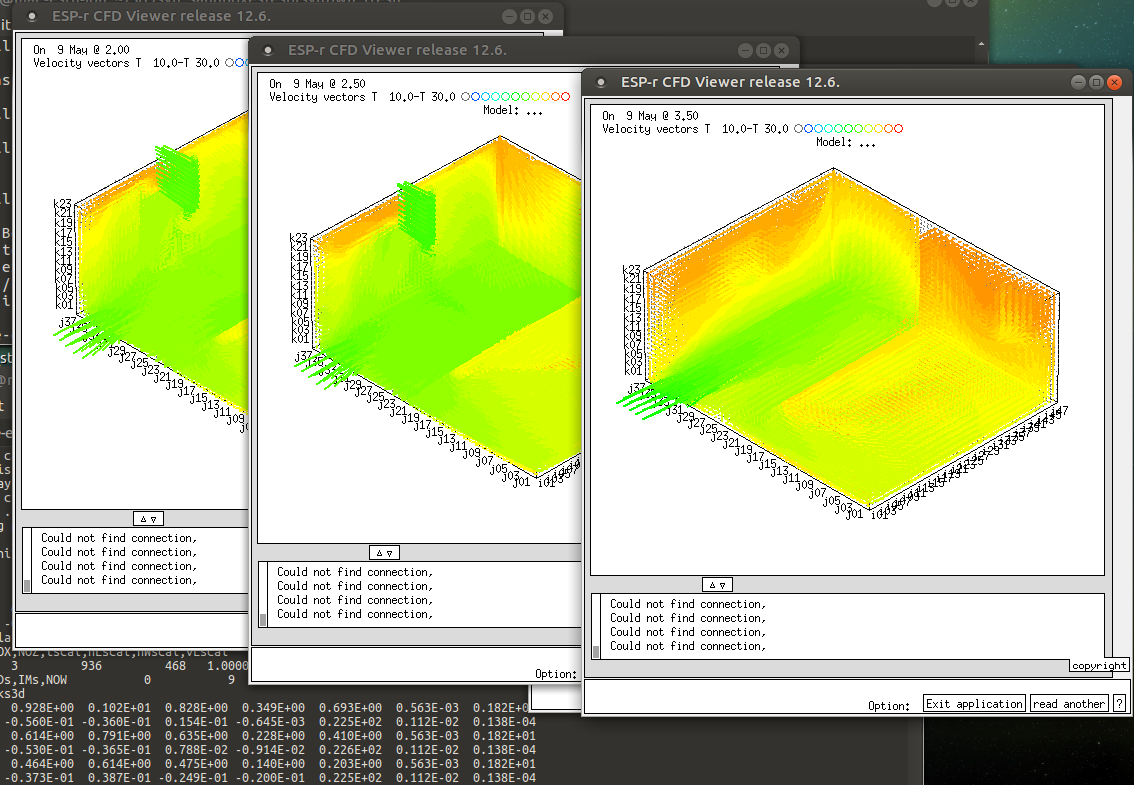
dfv is a utility that provides 3D views of CFD predictions at a single timestep and is called by bps each time the domain converges if the user agrees. It is passed an ASCII performance file as well as the CFD domain file. It briefly shows the CFD domain gridding and then overlays vectors of velocity in each cell coloured by temperature (in the same for used by res). For example, invoke dfv with:
e2r
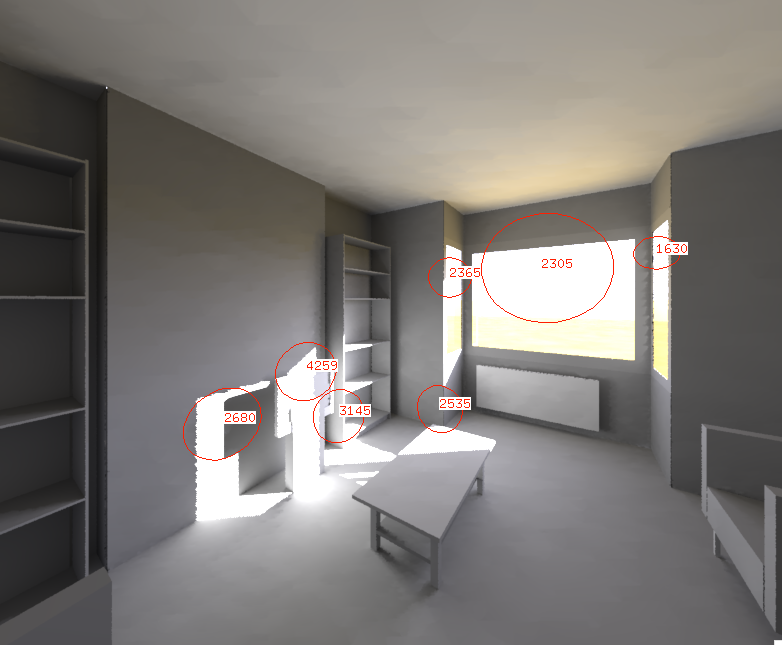
e2r is a manager, exporter, controller, and viewer of Radiance models. It takes a Radiance description exported from the Project Manager and then controls the creation of external or internal renderings, glare studies, false colour images, daylight factor plots as well as image sequences (e.g., shading patterns every 10 minutes over a day). All the entities are part of the ESP-r model – only the rendering parameters and the viewing directives are supplied by the user.
ecnv
ecnv is a model import and export facility. It is given an input_from format and an export_to format via command line options. The combinations are:
- ESP-r ⇒ DXF
- ESP-r ⇒ hidden line
- ESP-r ⇒ VRML
- DXF ⇒ ESP-r (to be depreciated)
- gbXML ⇒ ESP-r
Within the project manager the following conversions are also possible:
- ESP-r ⇒ IDF
- ESP-r ⇒ META file
- ESP-r ⇒ Radiance
- META file ⇒ ESP-r
- gbXML ⇒ ESP-r
An example invocation to create a DXF file:
ish
ish is a shading and insolation pre-processor and display tool. It deals with a single zone at a time. It takes in the model cfg file and one or more directives for tasks to be carried out. It is possible to monitor insolation patterns as they are calculated. This module is usually invoked from prj when changes in the model form and/or composition are detected. It deals with zones of arbitrary complexity within the surfaces-per-zone limits of the version of ESP-r you are working with includng those with expicit internal mass surfaces, e.g. included with pre-defined entities.
For example, the following command forces recalculation of shading and insolation in a specific zone:
grd
grd is a 2D and 3D conduction gridding specification tool. It is rarely used – perhaps because of the pedantic nature of 3D gridding and its initial research focus.
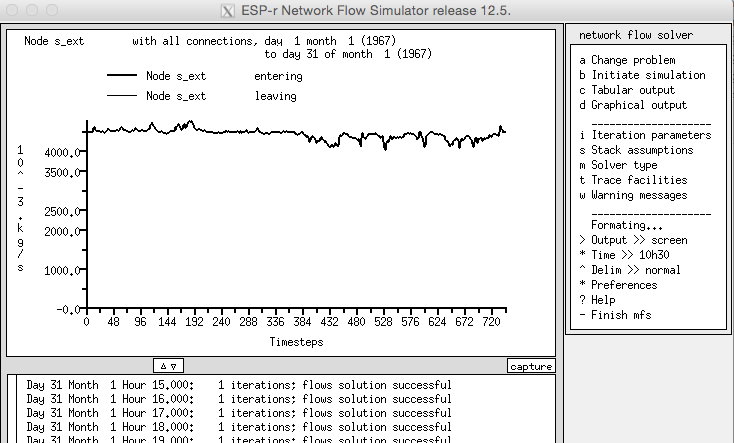
mfs
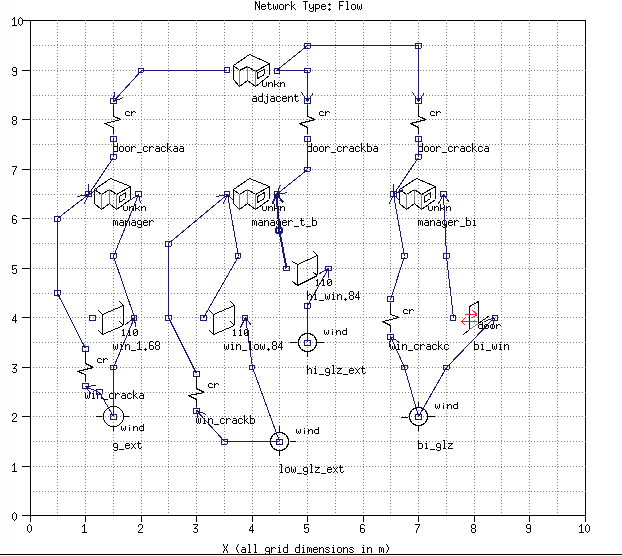
mfs is a stand-alone network flow solver that can be used to test whether a flow network is solvable. It is passed a network description and the user can select a weather pattern, control regime and period for assessment. Unlike the solution of flow networks as part of a multi-domain assessment, mfs assumes zone air temperatures are static. The figure below shows a small network being tested and the flow predictions. The following command starts the stand-alone solver with a specific flow network:
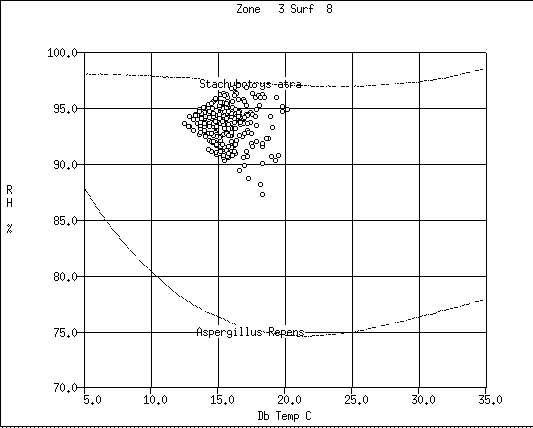
mld
mld is a stand-alone micotoxin display and reporting tool. It reads from a database of micotoxin growth properties and uses temperature and humidity patterns from simulations to assess the likely growth patterns.
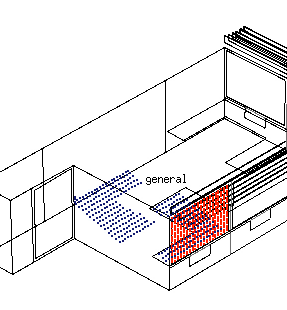
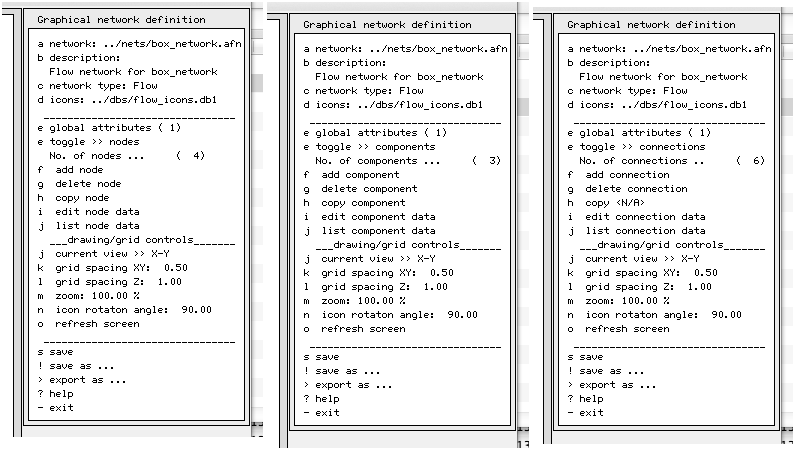
enet
enet is a graphic network topology creation tool which it typically used to create air flow networks (there is also a non-graphic approach to creating and managing air flow networks). The figure below shows the command menus focused on nodes (left), components (middle) and connections (right) as well as a typical network for windows and cracks in adjacent offices.
pdb
pdb is a plant component database management tool for those who want to explore the details of plant components (their nodal scheme and attributes), or convert between the ASCII and binary representations. It includes editing facilities, though this is rarely used as component developers tend to edit the ASCII version. For example:
res
res is a graphical results display and reporting tool. It reads the domain prediction files created by the simulator (bps) and presents them in many possible forms. It can also calculate basic statistics. More information about res is here.
Start an interactive session focused on a specific zone results file:
vwf
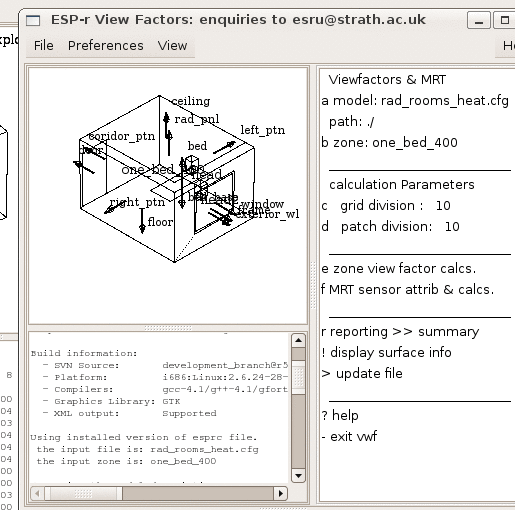
vwf is a suface-to-surface and MRT sensor body view factor calculation tool. It works with zones of arbitrary complexity, including those which include explicit surfaces representing internal mass (e.g. pre-defined entities). It has been tested for up to 240 surfaces in a zone.
It can be invoked from the Project Manager manually as well as automatically when the topology of a room changes. It is optional from the point of view of the user. If you think radiant exchanges are important the model resolution can be enhanced via this utility. It usually takes less than one minute to compute view factors for zones within the complexity limits of ESP-r.
An example of its use is shown below (note: this is an example of the alternative graphic interface that ESP-r modules can be compiled with):
viewer
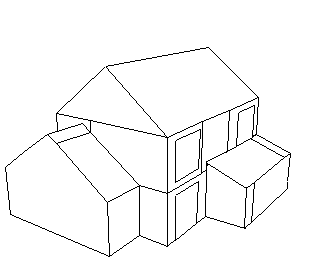
viewer is a hidden-line model display tool. It takes an export file from the ESP-r Project manager and renders it as a hidden line wireframe image (with or without dashed internal lines).
Climate Analysis (clm) – Details
The module clm works with lists of weather files (see below). These are largely sourced from third party sites such as [ref]. The module can convert EPW files as well as import column data and some MET Office files. There are both graphical and text-based weather analysis options.
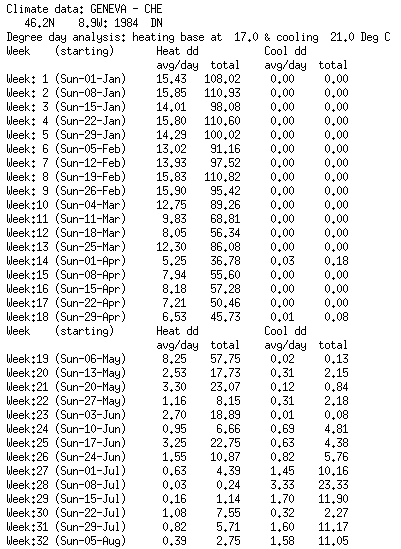
For season definitions supplied by the user (who might know their climate better!) heating and cooling Degree Days and solar radiation are used to establish typical periods. clm is also used to establish the meta data associated with weather files such as seasons and representative assessment periods (see below).
Project Manager (prj) – Details
The module prj has an extensive menu hierarchy to allow the user to control and coordinate the actions of the score of applications that make up the ESP-r suite. The hierarchy tends to reflect the diversity of the underlying data structure and the distributed model descriptive files.
In general, as the focus changes, the relevant model files are written into memory. Changes made in the prj are then written to the associated files. Global changes to models involve Input/Output to many small files. When prj requests the facilities of a utility module to carry out calculations, it passes the relevant command sequence to that module and awaits the completion of the task before merging the changes. Then, other aspects of the model may be dealt with.
Back to top | Back to Welcome page