Results reporting
The ESP-r simulator generates bespoke direct access binary files for each of its solution domains. There are several user defined levels of zone performance metrics (from a few high level entities to support for full zone and surface energy balances or temperatures at all nodes).
Depending on the size of the model, the duration of the assessment and the time frame, zone results files may range from a few MB to 40GB. This file is accessed via the res module which is designed for both interactive and scripted use. Users can follow a causal chain of enquiry as patterns are noticed. The types of performance data that can be captured are:
Zone data is recorded at each simulation timestep, flow data is typical at the same frequency as the zone but plant and electrical data could be a multiple of the zone timestep.
The save level specified during the simulation sets the extent of what is saved. There is also an option to dump information into a MySQL database from within the simulation engine. Within the recorded set of performance metrics res provides lists of topics and reporting formats as will be seen below. The scope of reporting can be set by the user in terms of the duration, the zones or surface included. The data can also be written to file e.g. CSV with user defined tag:data separators.
Reporting forms
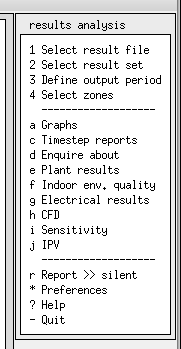
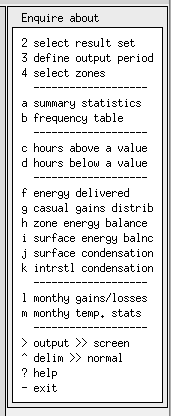
The ESP-r res module includes tables, graphs and timestep column data.
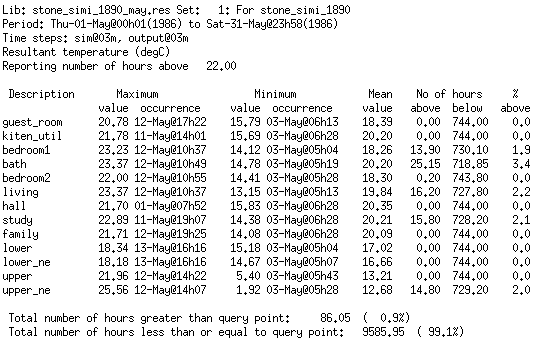
Pre-defined tables
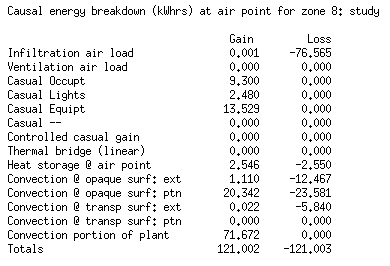
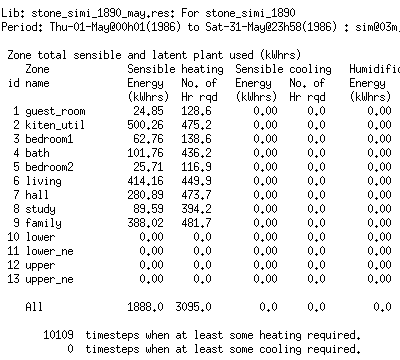
ESP-r includes a number of pre-defined tables. These have evolved over time to support the needs of design teams and researchers. Below are some examples:
 see full size
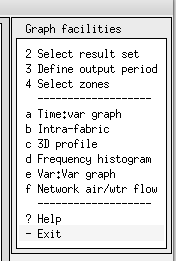
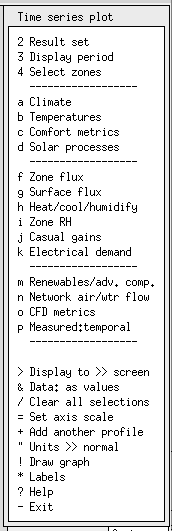
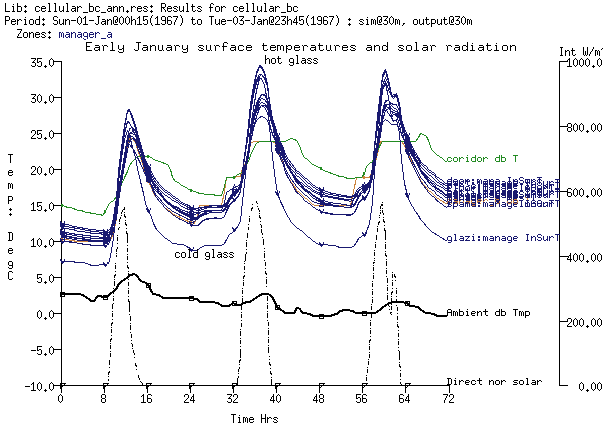
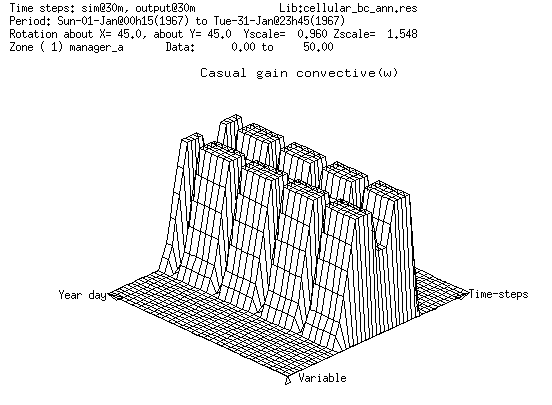
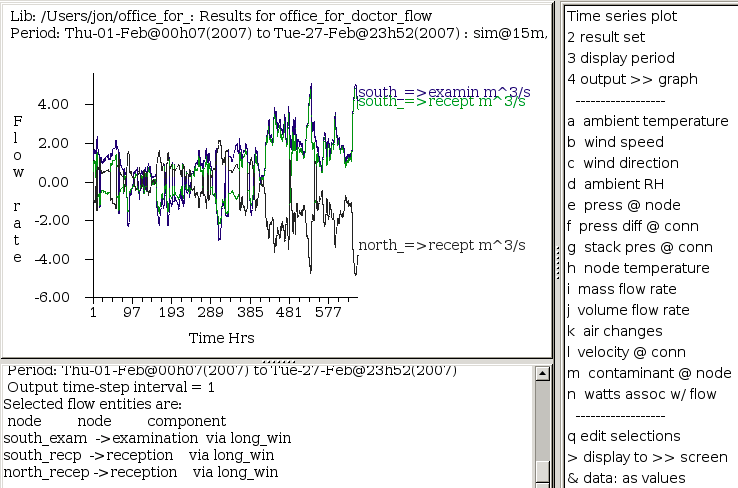
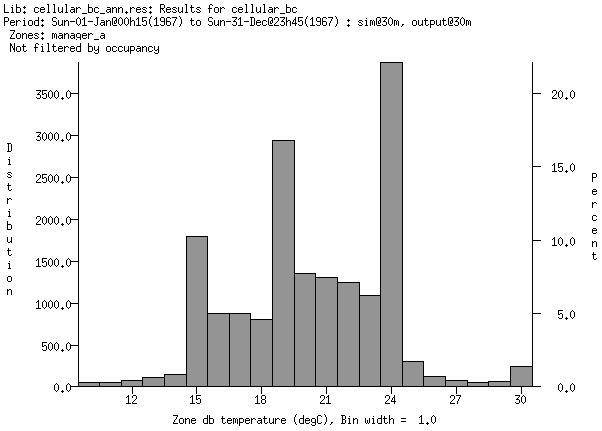
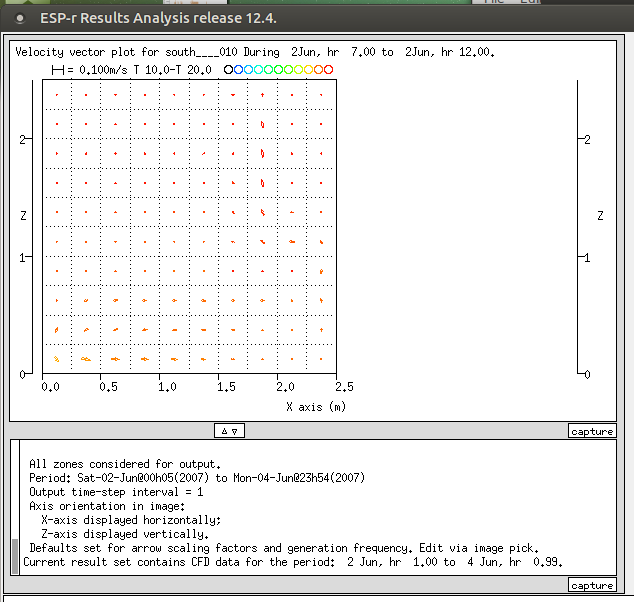
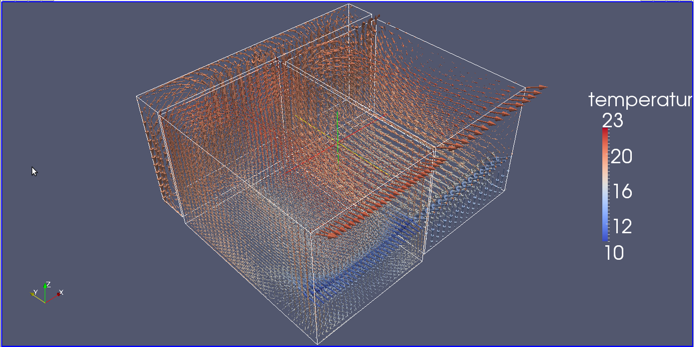
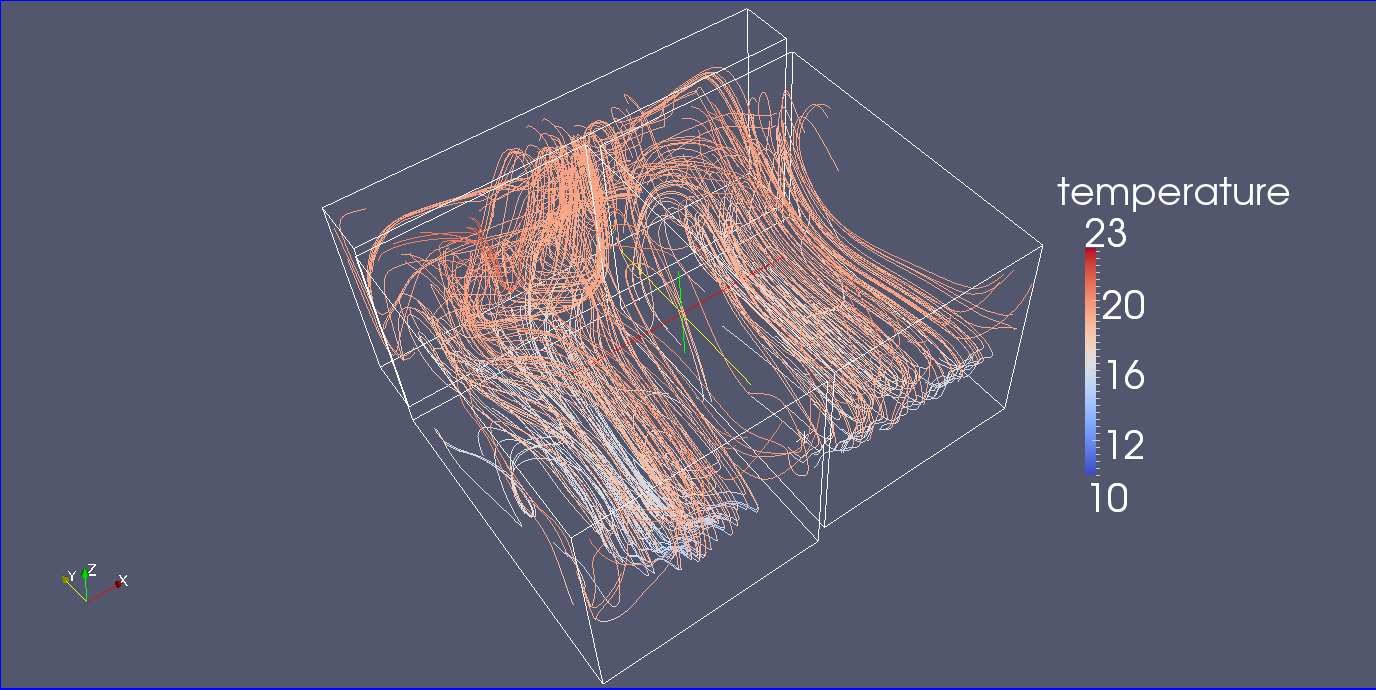
Graphs
Performance metrics included in tables can also be graphed in several forms. Here are some examples:
 see full size
 see full size
 see full size
 see full size
 see full size
Software agents
If the user toggles the reporting from the in-built display to export to a file e.g. CSV files the column data can be used in spreadsheets.
If the res module is run in scripting mode it can be driven to generate a sequence of reports in standard formats which can then be subjected to post-processing. This has been used in large scale parametric studies. Often other software agents e.g. bash scripts are used to drive ESp-r modules to carry out the necessary tasks.
 see full size
 see full size
Provenance of performance data
Each table includes a header noting the library it was extracted from, the time period and frequency as well as titles which are auto generated. Usually units are included. Where the report includes specific surfaces these are usually labeled via a zone:surface scheme.
Back to top | Back to Welcome page