Methodology
The project process was planned out using project management techniques giving a deliverable set of objectives throughout the project life cycle. The first objective was to identify the boundaries of BoP and the breakdown of its components. To do this the project team used a tool called a function means tree with which the team provided the data described in the BoP section. With this information the different areas were researched and the literature review was compiled, data was collected and the tools were developed.
Literature Review
Data Collection
BoP Cost Tool Development
BoP Carbon Tool Development
Literature Review
Ardente,F. et al, 2008. Energy performances and life cycle assessment of an Italian wind farm. Renewable and sustainable energy reviews, 12, 200-217.
EWEA, 2009. Wind Energy: The facts. Brussels:European Wind Energy Association.
Industrial Technology Systems Limited (ITS):Wind-farm Scada Systems.
Data Collection
Historical cost data for the different aspects of BoP was then collected from the literature. Tender data was also supplied from Sgurr Energy to enable an accurate and current range of costing data. All data gathered was subject to a non disclosure agreement that was agreed by all parties before commencement. Once a sunstantial body of work was obtained relating to the BoP costs these were used to develop the tools.
BoP Cost Tool Development
Input
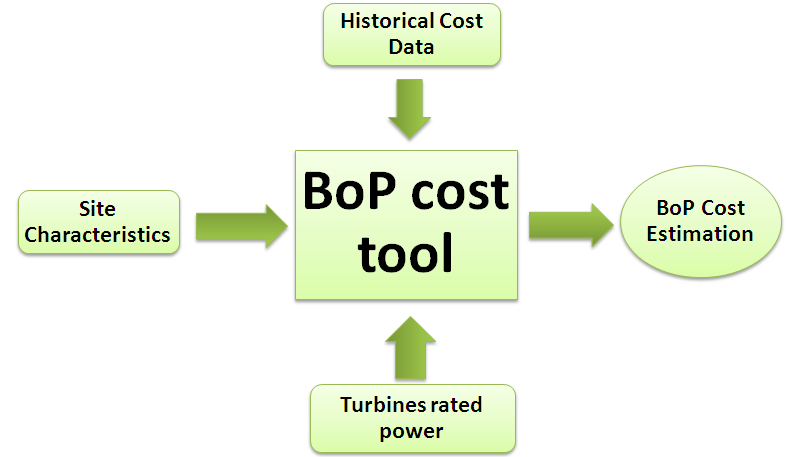
One of the outcomes of this project is the Balance of Plant (BoP) cost tool. It is able to offer estimates of the BoP cost for a wind farm project. The inputs required are the site characteristics, the turbines rated power and a historical cost database.
Site characteristics
The site characteristics are reduced to a small number of inputs which are entered on the tool’s front page. These inputs are the total number of turbines to be installed, the road length to be constructed and upgraded and the cable length to be installed to connect the wind turbines with the substation in the wind farm and to the grid connection.
The number of turbines is directly obtained from the project plan.
The road length to be constructed is the sum of the road needed within the wind farm and the access road to connect the wind farm with the closest existing road. The road length within the wind farm will depend on the layout of the turbines and the roads connecting them and normally it is in a range of 400 to 500 metres per turbine. The access road length depends on the distance to the existing road. Usually the existing road needs some upgrades and the length covered by these upgrades is also an input.
The cable length to substation depends on the layout of the wind farm and how the cables are trenched. Usually the cables are installed underground following the roads, so the same range of 400 to 500 metres of cable to substation per turbine may be applied. The cable length to grid depends on the distance from the site substation to the closest grid point of connection.
Historical data
There is a sheet assigned for each of the 11 categories in which the BoP cost has been broken down. Data from past projects is entered here. From the available information it will be determined the total cost of each standard category according to the suggested breakdown and the rated power of the wind farm. Also the number of elements (number of foundations, crane pads,…) or units (km of road, cables,…) on each category is determined. The input data required on each row is the total cost of the category together with the number of elements or units of this category and the turbine or wind farm rated power.
The sheets for each category are independents, so in case of incomplete available data the categories whose costs are known can be entered so they populate the historical data base. The rows of data that can be entered on each category is up to 50, however it has no practical limit and can be easily extended.
Turbines rated power
The rated power of the individual turbines and the wind farm are entered in the front page. On each category sheet a sizing factor is also entered. This sizing factor is a measure of how the size or rated power of the turbine affects the cost of the elements in this category. A higher factor implies a larger impact on the cost. Usually this factor is between 0 and 2 and it can be determined to adjust the historical data. On each category’s sheet a graph of the element or unit cost versus the size of the turbine or wind farm is offered. If there is not a clear increasing trend of the cost for larger turbines the sizing factor will be chosen close to 0. A general recommendation in order to adjust the sizing factor is to divide the slope value of the historical trend line by the Average cost/MW shown in the same sheet.
Calculation Method
From the historical data base of each category, the average cost of each element or unit of the category is calculated, for example the cost of each turbine or the cost of each km of road. Also this average cost per MW of turbine and the average turbine size of the historical data is calculated. Using these results, the cost for projects with a different number and size of turbines and different lengths of roads and cables is extrapolated from the historical data base. A linear relationship is applied, and for each road the extrapolated cost for the user input is calculated.
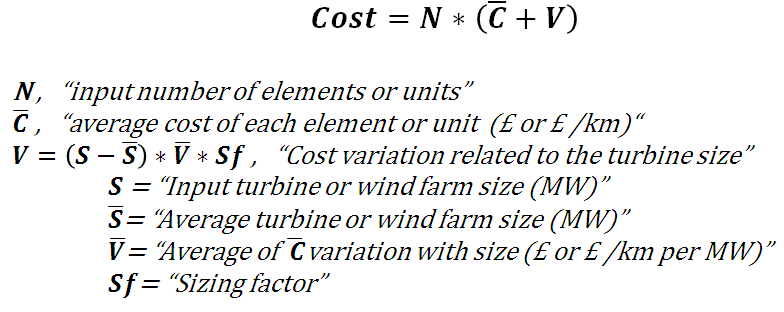
For a given input, a sample of the different estimated cost for a given input is obtained. Each of the values of this sample is obtained by extrapolating the cost of each of the historical data rows with the formula shown above. These values are used to offer the results numerically and visually.
Output
For each of the categories the tool calculates a cost sample where each value is obtained from each past project data. On the front page, the median for each category’s cost sample is shown numerically, and the sum of these values is offered as the total BoP cost estimate. The information is also offered on a coloured pie chart showing the breakdown of the cost in categories. These values can be considered as the standard cost for the user input derived from the historical data base.
In addition, the second sheet offers a graphic box plot of the cost for each of the categories. In this way, not only the cost estimate for each category is shown, but also the dispersion and skewness of the sample. The range inside the boxes represents where the 50% of the data is, the 25% below and the 25% above the median (2nd and 3rd quartiles). The whiskers indicate the lowest datum still within 1.5 IQR of the lower quartile, and the highest datum still within 1.5 IQR of the upper quartile. The data outside these limits is shown as outliers.
BoP Carbon Tool Development
Carbon
Wind energy is often purported on its green credentials, namely that there are no Greenhouse Gas (GHG) emissions produced as the turbines are generating electricity. This is valid only between the boundaries of gate-to-gate; if we are to consider the life-cycle of a wind farm we have to acknowledge that there are energy and carbon intensive processes in producing a wind farm. Essentially a cradle-to-grave approach has to be taken.
A carbon life-cycle analysis identifies all the phases of wind farm construction, direct or indirect, where there are carbon dioxide and its equivalents (CO2e) emissions. The boundaries of such a system include:
Refining of raw materials
Construction, operation and decommissioning of generating plant
Transport of materials and for maintenance
Management of wastes from construction and decommissioning phases
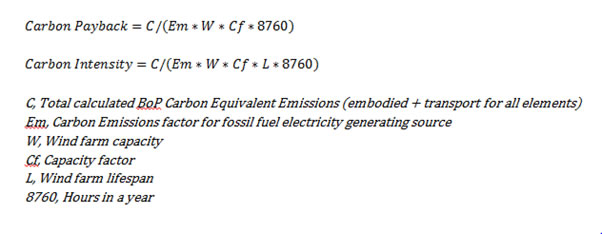
The environmental performance of the wind farm can be assessed using the environmental indices of Carbon payback and Carbon intensity (footprint). The Carbon payback is a ratio of the CO2e emissions arising from the life-cycle to the carbon savings made from generating electricity with a renewable source instead of fossil fuel generation. The Carbon intensity is a measure of the life-cycle CO2e emissions against the total electrical energy output over the lifetime of the generator.
Carbon tool
Input
The outcome of producing this tool is to estimate the embodied carbon from the BoP elements determined from the embodied carbon from the construction materials of the elements and carbon emissions resulting from transporting them from source to site. Further to this, its environmental performance will be presented in terms of the environmental indices Carbon Payback and Carbon Intensity.
A carbon tool was envisioned by our group that would calculate the carbon costs for the balance of plant. It was decided, due to a lack of resources, that the tool would only incorporate the boundaries of the embodied carbon of the construction materials and the transportation of the materials from the manufacturing source to site. However it is likely, from similar studies, that the biggest carbon costs will come from the construction phases. The values for the embodied carbon in construction materials originated from the Environment Agency, while DEFRA was sourced for the emissions factors of fossil fuel power plants and for the emissions from transportations.
Wind Farm Parameters
The front page of the tool offers the user to input some wind farm parameters such as the number of turbines, turbine rating, capacity factor and wind farm lifespan. Further inputs in the tool allow you to select the emissions factor for a fossil fuel electricity generating source for which the carbon savings will be calculated against.
Embodied Carbon of Construction Materials
The second page of the tool allows dimensional inputs for the elements of BoP such as lengths, width and depths of foundations, which are then converted into masses and then a value of embodied carbon is returned for that element. Some of the elements offer different construction materials which have different embodied carbon values so that comparisons can be made. Onsite cabling, trenches and roads are estimated at 500m per installed turbine and lengths of which are thus calculated from the number of turbines.
Transportation
Carbon costs arising from the transportation of the construction materials are also calculated by entering distance from the source of the material to the construction site in km. It is assumed that the emissions factor for transport is 0.9802 kg CO2e/vehicle km (DEFRA) arising from a UK average articulated lorry with 60% loading, it is further assumed in the calculation that the articulated lorry has a maximum carrying capacity of 20 tonnes (44 tonnes maximum gross weight).
Calculation
Calculation Method
The total BoP carbon equivalent emission is simply calculated by adding together the calculated embodied carbon and transported carbon for each element’s construction material. The environmental performance indicators are calculated as follows.
Output
The front page shows the total BoP carbon calculated and the breakdown from each BoP element. The values are presented both numerically and also displayed graphically on a pie chart representing their associated percentages. The environmental performance indicators are shown in boxes on the front page.