Hybrid Energy Systems in Future Low Carbon Buildings
 
Scope  
Background  
Micro wind  
Heat pumps  
Heat recovery  
Solar thermal panels  
Pv  
Bipvt  
Chp  
EarthToAir heat exchange  
Passive design  
Thermal storage  
Design concept  
Hybrid concept  
Methodology  
Modelling tools  
Case study results  
Environmental impact  


Photovoltaics - Background Information
      PVs are used in order to convert solar energy into electric power. They make use of solar cells to produce direct current so as to power equipment or to recharge a battery. An inverter whose efficiency is about 95% is necessary in order to convert the DC current produced by PVs to AC. Solar cells must be protected from damages so most of the times are closely packed behind a sheet made of glass. The power which is required is usually much bigger than that a single solar cell can deliver, thus cells are electrically connected together to make solar panels - solar modules. The solar panel is Hybrid power systems
then used in a larger photovoltaic system as a component. We create then a linked connection of solar panels to create a photovoltaic array. In a PV array now the PV panels are firstly connected in series in order to obtain the required voltage and then the 'individual strings' are connected in parallel so as to provide the desired current to our system.

      The building integrated PV systems are particularly materials which are used to replace the ordinary construction materials in certain regions of a building such as roof and windows. They are available in several forms like flat roofs, pitched roofs, facades and glazing. These PV materials are used more and more nowadays as they can provide the new buildings with sufficient electrical power, while they can be positioned also to existing buildings. PVs are an opportunity for making an aesthetically appealing and attractive building. It is very important also that they don't produce noise. BIPVs can serve as thermal insulation materials because of their sandwich construction (the modules themselves, the layer of air within the modules, the ray absorption by the crystalline silicon) meaning we have a diminishing heat loss from the
interior of the building to the exterior environment. They are used as a basic or additional source of power. If the building is at a small distance from the existing grid, the optimum usage of the PVs is applicable; they can cover the building's needs and sell then the superfluity to the grid, having a specific feed-in tariff.

In the event the building's electrical energy requirements cannot be covered by the PVs, electricity can be sent to our structure from the grid. Furthermore, PV systems may be the best solution if the building is far away from the grid, as they generate the necessary electrical power which can be stored in batteries; so when PVs produce a surplus of electric energy they charge these batteries in order to use the storage energy later on. As a result buildings using PV systems get power from the grid only when the energy which is generated from the PVs isn't adequate or the when batteries are not fully charged. They are in other words semi-autonomous electrical generated systems.

Hybrid power systems
      The electrical characteristics of PVs are provided by I-V curves which are given by their manufactures, examples of I-V curves are given below.
Solar cell Voltage curve
Curve The manufacturers provide the PVs power output in standard test conditions which are:
  • incident radiance equal to 1000 W/m2
  • temperature T= 25 °C
  • AM 1.5


      The aim is to operate the system as close as possible to the maximum power point (Pmax) in which the voltage has the value Vmp and the current the value Imp. We should also know the short-circuit current (Isc), meaning the current for V=0 and the open-circuit voltage (Voc) which is the voltage for I=0. The temperature has an impact upon the PVs' voltage, while the current I is affected by the amount and the intensity of the incident solar radiation. We try to optimize the power, to find the Pmax point by changing the system's voltage. Another important variable quantity immerging from the above quantities is the Fill Factor [3]

       The PV's efficiency is the measurement of their performance and a typical commercial one obtains an average efficiency of about 13% meaning that almost 1/7 of the total incident irradiance is turned into electricity. The best ones which are commercially available acquire an efficiency of 20%. Their performance is affected by 6 major different parameters.

  • Different technology (the various types will be presented later)
  • Temperature. The power output (as we can see also from the above images) is influenced by the temperature [°C]. We have a 0.5%/°C [4] decrease in their performance and we try generally to operate the PVs to temperatures close to room temperatures. (25°C). Also their life duration is decreased if T>25°C.
  • Orientation The geographical location of our buildings needs to be considered, the PVs must face south in the northern hemisphere and north in the southern one and most of the times are fixed-based PVs.
  • Tilt angle. When we install the PVs we know the place's latitude and most of the times PV panels are set to an angle which is almost equal to that (we are going to demonstrate how that angle varies across Europe). PVs in order to be more effective should face the sun for as much time as possible since their electrical output is determined by the incidence of solar radiation to their surfaces. The average number of kWh/m2 per day is the correct measurement of solar energy since we should take into account that all regions aren't sunny, that clouds exist during some days etc. If we manage to shift PV modules so that they follow the sun's movement then we achieve a large increase in the power we produce and that increase is even larger during the summer period. The effectiveness can increase by managing to adopt a different angle during different specific period of time, for instance to provide through a particular mechanism an angle for the winter period which then can be changed during the summer. The gain of using trackers is a 30% increase in the efficiency (20% during winter and 50% during summer) and thus we outweigh the additional cost and complexity to our system.
  • Shading. Most of the PVs are extremely sensitive towards shading effects. Other buildings, trees, physical and technical obstructions can diminish a lot, even half, the amount of solar energy which is incident to PVs' surface. When even a small percentage of a PV panel is shaded, while the remainder is normally exposed to the sunlight, the power output can de decreased significantly. Only some PVs such as thin film solar cells that have bypass diodes can reduce/minimize shading effects and get power from the panel's portion which isn't shaded. Furthermore, the PVs efficiency can be influenced and diminished because of the dust or any other remnants-residues that exist in their surface so we should clean and take care of the PVs surfaces in regular time intervals
  • The irradiance potential of the site (the different irradiance levels among Europe will be discussed later on)

Different PV types

  • CRYSTALLINE PVs
    They share about 90% of the whole market and they can be divided into 3 categories:
    • Monocrystalline (sc-Si)
    • Polycrystalline (mc-Si)
    • Ribbon silicon (ribbon-sheet c-Si)
    The monocrystalline PVs are more expensive than the polycrystalline ones but they have at the same time the maximum power output/m2. Moreover, they are more reliable into harsh environments. The advantage of the ribbon silicon ones (n=12-13%) is that they require 50% less Si.
  • THIN FILM PVs
    These PVs represent nowadays almost the 10% of the market. They have lower efficiency but this drawback is outweighed by their lower cost of production. Therefore, they require almost double area than the crystalline ones in order to achieve the same power output. They aren't so much influenced by the high T, while they can also absorb a wider range of the light spectrum. They have better performance concerning the diffuse radiation. There are 4 major categories of thin films now concerning the active material which is used:

    • Amorphous silicon (a-Si)
    • Cadmium telluride (CdTe)
    • Copper indium/gallium Diselenide/disulphide (CIS, CIGS)
    • Multi junction cells
    The a-Si is by far the most commonly used thin film material
  • HYBRID PVs
    They are constructed by placing several layers of different technologies. The most famous combination is the a-Si, sc-Si, a-Si one. They can bear high T and they make a well usage of the diffuse radiation but they are very expensive.

Hybrid-pvs

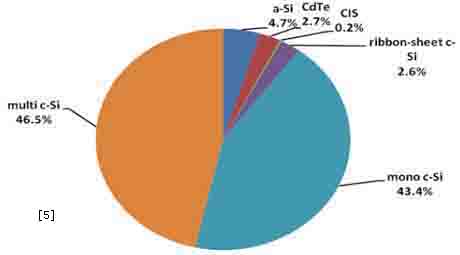
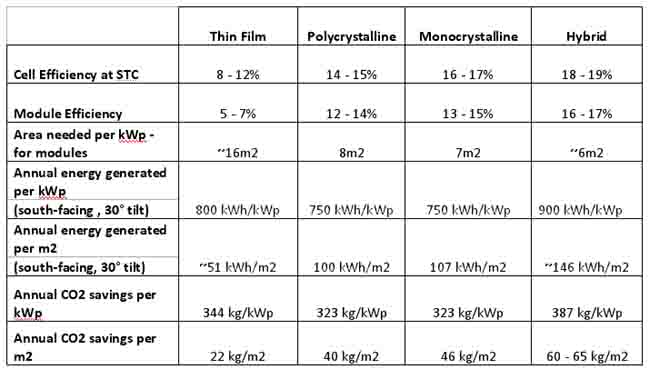
The following table demonstrates several identical numbers concerning the different technologies and the graph below shows us what the achieved efficiencies in the lab relative to the various PV are.

Different technologies[6]


Achieved efficiencies


There will be clearly 2 types of products for some upcoming time and the space availability would be the deciding factor for each case:

   ♦   The expensive ones but with high efficiency per m2

   ♦   The cheap ones with lower efficiency per m2

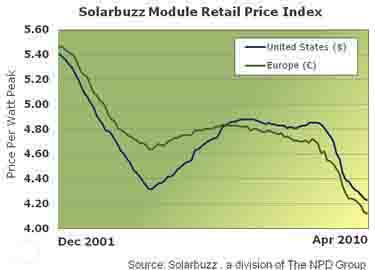
      The solar cells industry has expanded dramatically during recent years due to the growing demand for applications and usage of renewable energy systems. The target of the PV's industry is to decrease their cost while improving their efficiency at the same time. Their cost is relatively high today but prices are continuously falling as time goes on and the additional initial cost is even lower taking into account that we don't spend the money needed to use conventional construction materials.

Module prices


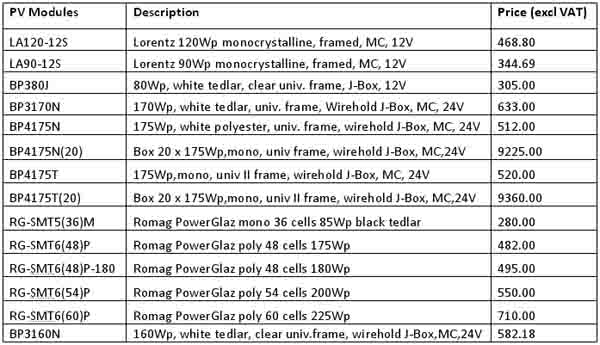
The lowest retail prices (excluding sale taxes) for the different PV technologies are:

   ♦   Monocrystalline --> 1.68€/Wp
   ♦   Polycrystalline --> 1.39€/Wp
   ♦   Thin film --> 1.25€/Wp for a 130 Wp solar panel

The industry is targeting 1€/Wp for polycrystalline and thin film PVs. [7]

The following table presents the prices for different PV modules.

Pv module prices


      The PVs and their mechanisms require low maintenance (only a small part of their cost) and they have typically a duration life of 25 - 30 years. PV panels can be recycled, offering the opportunity to reuse materials that have been used during the production process. Another significant aspect is that after 25 years they are able to provide over 80% of their initial power output. For instance for the PV module BP3230T, the BP solar provides the following warranty :  [8]
- free from defects in materials and workmanship for 5 years
- 93% power output over 12 years
- 85% power output over 25 years

The module price stands for about 50% to 60% of the total installation cost for BIPVs, since money is also spent on wiring, meter, inverter and their placement - installation. Therefore, the bigger our integrated PV system, the lower its price/kWp. The indicative cost for the whole installation of a PV system of 1kWp is about 6,000 to 7,000 £/kWp and for a 5kWp one about 5,000£/kWp. When the PV system is integrated the cost is 8,000 to 9,000 £/kWp [9].An indicative household consumes around 3,000 - 4,000 kWh/year and a 1kWp to 5kWp PV installation can cover between 25% and 100% of its requirements depending on its location across Europe and the total installed power output. [10]

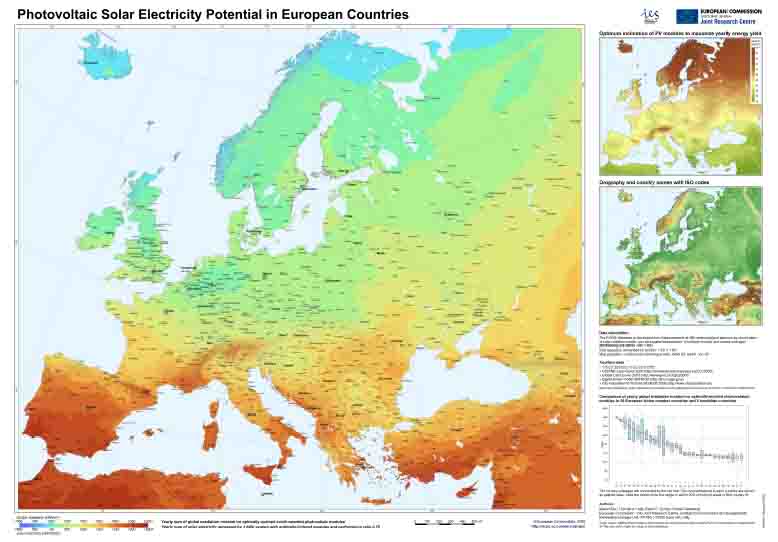
Many governments provide motives (feed-in tariffs) in order to increase the amount of the installed PVs and therefore decrease their CO2 emissions. Some indicative feed-in tariffs for 3 European countries are:
- UK --> 0.361 £/kWh [11]
- France --> 0.55 €/kWh [12]
- Greece --> 0.55 €/kWh [13]

The yearly sum of global irradiation [kWh/m2] on PV panels which are south oriented and optimally inclined in European countries, for an average during the period from 1981 to 1990, is illustrated on the following map. The amount of electricity which is generated by 1kWp PV system [kWh/kWp] is, for a system that has a 0.75 performance ratio. Furthermore, on the top right of the map, you may notice the optimum angle for placing the PV panels across the whole Europe in order to achieve the maximum energy output during operation.


European zones

From the above map, we can roughly divide the European countries into 4 zones.


Zone 1: < 750 kWh/kWp
  • Northern UK - Scotland
  • Northern Germany
  • Netherlands
  • Belgium
  • Scandinavia
Zone 2: 750-1000 kWh/kWp
  • Southern UK
  • North-East France
  • Germany
  • Eastern Europe
  • Austria
  • Hungary
Zone 3: 1000-1250 kWh/kWp
  • Southern France
  • Northern Greece
  • Bulgary
  • Northern Spain
  • Northern Italy
  • Portugal
Zone 4: >1250 kWh/kWp
  • Southern Spain
  • Southern Italy
  • Southern Greece
  • Cyprus
As already mentioned, the orientation and the tilt angle of the PV panels affect their performance significantly. If they are optimally inclined we can achieve a 9-26% increase upon their electrical output compared to the electricity which is produced by a horizontally placed PV. Thus, we acquire an output of 760kWh/kWp in Scotland and 1510kWh/kWp in Portugal. The highest influence is noted in the Northern countries (Scandinavia) and the lowest in Southern Greece.


Optimum inclination

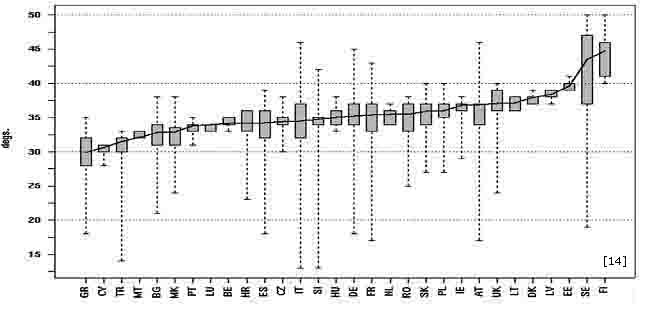
Optimum inclination angle for a South-facing PV module

Since our 2 case studies are in Glasgow and Palermo respectively we provide more specific maps concerning global irradiation and the relevant produced electricity by the PVs for the United Kingdom and Italy.


Global irradiation UK
Global irradiation Italy
Global irradiation UK
Global irradiation Italy

Available performance calculator for grid- connected PV Systems


References

[1] Small "Hybrid" Solar and Wind Electric Systems
[2] Papachristos C., Xatzixristou D., Technology of electricity generation by the solar energy, (Salonica, 2007)
[3] Zaxarias Thomas, Soft Energy Sources II, University of Patras, Department of electrical and computer engineering, (Patra 2006)
[4] A 'Real World' Examination of PV System Design and Performance, Allan Gregg1, Terence Parker1 and Ron Swenson2, 1.United Solar Ovonic LLC, Auburn Hills, Michigan 48326 and 2. Solar Quest ® Santa Cruz, CA950
[5] EPIA European Photovoltaic Industry Assossiation (Epia.org), Solar electricity for over one billion people and two million jobs by 2020, Solar Generation IV-2007
[6] Pv system technology variations
[7] Solar Module Price Highlights
[8] BP Solar Limited warranty certificate
[9] Photovoltaic (PV) by the Oxford Solar Initiative
[10] Photovoltaics - costs and benefits
[11] Feed-in Tariff (Clean Energy Cashback) scheme
[12] How to compute a BIPV feed in tariff - the French experience
[13] Exploring the legal issues for roof top solar developers
[14] Marcel S., Thomas A. Huld, Ewan D. Dunlop, Heinz A. Ossenbrink, Potential of solar electricity generation in the European Union member states and candidate countries, Science Direct

Images source: Click on the images to see the source