North Sea

Shown here are the 100m mean windspeeds for certain fields/rigs.
It is extremely windy in the North Sea, with 100m windspeed ranging from just under 8 m/s in the south, to over 12 m/s in the north. The prospects for electricity generation from the wind are exceptionally good.
  1. Brent
  2. Maureen
  3. Beatrice
  4. Rough
  5. Helm
  6. Schwedenck
  7. Morecombe

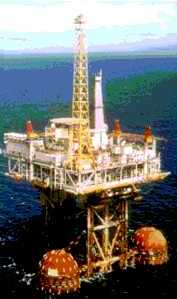
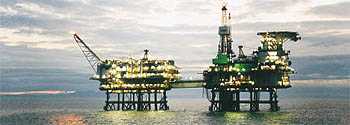
  • Most of these rigs/fields are in the North Sea. The exceptions are Morecombe, which is in the Irish Sea and Schwedeneck, which is in the Baltic Sea.
  • Most of them are near shore. The exceptions are Brent and Maureen
  • Most of them have steel jackets. The exceptions are Maureen and Schwedeneck.

Shown below is the predicted power generated by a wind turbine at these locations in the North Sea.

N.B. We initially used wind data from various different sources. However, for the purposes of this report, the data used in the windspeed graph above and in the calculation of expected power output(some graphs of which are shown below) came from one consistent source; a paper called "UK offshore wind resource", published in "Wind Engineering".
While this data was satisfactory for an initial appraisal, a more complete evaluation would have been possible if we had access to the weather data which is collected on oil and gas platforms.

Brent Spar

With a mean windspeed of 12.88 m/s, the prospects for electricity generation from the wind in the Brent field are exceptional. If a 2MW wind turbine was erected in the Brent field, off the east coast of Shetland, then it could generate more than 10 million kWh per year. Also shown is a picture of Brent Spar.
photo htp://www.greenpeace.org

Maureen

The 100m mean windspeed is 12.6 m/s, the prospects for electricity generation from the wind on Maureen are exceptional. Maureen has finished pumping oil and the latest is that the oil company are trying to sell it. If they put a 2MW turbine on it then they could expect to generate about 10 million kWh per year.

Beatrice

The 100m mean windspeed is 10 m/s. This oil field has 4 rigs and is about 20 km off of the NW coast of Scotland, in the Moray firth. If a 2 MW wind turbine was erected here it could generate over 8 million kWh per year. See "real case" for more on this.

Rough

With a 100m mean windspeed of 9.71 m/s, if a 2MW wind turbine was erected on Rough it could generate just about 8 million kWh per year.

Helm

With a 100m mean windspeed of 11.06 m/s, if a 2MW wind turbine was erected on Helm it could generate about 10 milion kWh per year.

Schwedeneck

Located in the Baltic Sea just north of the German coast and with a 100m mean windspeed of 9.23 m/s , this is the only location where it looks to be better to choose the 1.8 MW over the 2MW wind turbine. On Schwedeneck a 1.8MW could generate over 8 million kWh per year.

Morecombe

With a 100m mean windspeed of 9.82 m/s, a 2MW wind turbine in the Morecombe field could generate 8 million kWh per year.

World map


Mediterranean Sea


Mediterranean Sea:

Around those few rigs which are in the Mediterranean Sea, the 100m mean windspeed is given by the Riso European Offshore Wind Atlas as being between 7.5 m/s and 8.5 m/s.
We have taken 8 m/s as being a broadly representative figure for the area.
  • Med.Sea
  • Tunisia
  • Malta
  • Barcelona
Comparing this figure with other values obtained, an increase of 16% can be seen between the figure for Malta and the Riso figure, consistent with our expectation of coastal windspeeds being 10% to 20% slower than those offshore.

World map


Red Sea


Elat 29,33N 34,57E - head of the Gulf Of Aquaba, Red Sea

100m mean windspeed of 8.22 m/s.
This value is the highest we found in the Red Sea, perhaps caused by the wind being funneled up the Gulf by the landscape.
Wind resource here is fair to good.

World map


Persian Gulf

Al Bahrayn 26,16N 50,37E- Persian Gulf

100m mean windspeed of 7.51 m/s, this shows that there is potential for electricity generation from offshore wind, and perhaps for re-use in the Persian Gulf.
World map


Australasia

Australasia:

As can be seen from this graph, in this part of the world coastal windspeed increases to the south, from 4.29 m/s in Malaysia (Balikpapan and Pontianak) to 8.94 m/s at Wilson Promontory, Southern Australia.
World map


Southern Borneo


Balikpapan, Southern Borneo, 01,16S 116,54E

100m mean windspeed is 4.29 m/s
Has a seasonal variation from a low of 4.29 m/s, January to June and a high of 5.24 m/s in monsoon season, October to December.
Prospects for electricity generation from the wind seem poor.
World map


Western Borneo


Pontianak, Western Borneo 0,01S 109,23S

100m mean windspeed is also 4.29 M/S
Has a seasonal variation from a low of 2.86 m/s, April to September and a high of 4.29 m/s in January to March.
Prospects for electricity generation from the wind seem poor.
World map


North-Western Australia

Australia: Northwest

Broome, 17,57S 122,13E
100m mean windspeed is 4.65 m/s
Prospects for electricity generation from the wind seem fairly poor.

Carnarvon, 24,53S 113,40E
100m mean windspeed is 7.16 m/s
Prospects for electricity generation from the wind seem fair.
World map


South Australia


Southern Australia

Gabo Island 37,34S 149,54E
100m mean windspeed is 8.23 m/s
Prospects for electricity generation from the wind seem good.

Wilson's Promontory 39,08S 146,25E
100m mean windspeed is 8.94 m/s
Prospects for electricity generation from the wind seem good.
A 2MW wind turbine here could generate about 8 million kWh per year.
World map


South America

South America

Coastal windspeed increases towards the south of the continent, from 2.86m/s (Trinidad and Maracaibo) in the north to 11.44m/s (Islas Ano Nuevo) at the very southern tip.

Overall the wind resource of offshore oil fields is interesting, especially around Fernando De Noronha and the Cape.
World map


Cape Horn


Islas Ano Nuevo, Cape Horn 54,39S 64,08W

These islands are situated at the southern tip of South America, with a 100m mean annual windspeed of 11.45m/s, this is an extremely windy part of the world. Any machines placed here would have to be designed to withstand gales.

Overall, extremely promising for electricity genration from the wind.A 2MW wind turbine could generate about 10 million kWh per year.

World map


Rio De Janeiro


Rio De Janeiro,Brazil 22,54S 43,10W

Mean annual 100m windspeed of 6.08m/s.
One Vestas V66-1650 could generate as much as 3 million kWh per year in this wind profile.

If 6.08m/s windspeed increases by between 10% and 20% by moving offshore,then this could be a possible site for wind turbines.

Overall, wind resource is promising.
World map


Noronha


Fernando De Noronha, Brazil 3,51S 32,25W

With a 100m mean windspeed of 9.3m/s, this area looks extremely promising for electricity generation.

For example, a single 2MW turbine from NEG-Micon could generate as much as 8 million kWh per year.

World map


Trinidad


Port Of Spain, Trinidad 10,40N 61,31W

An island off the North-East coast of South America, it has a mean annual windspeed of 2.86m/s.

Trinidad is north of the equator, however maximum mean windspeed occurs spring/summer, in April to June, 3.33m/s.

Overall, wind resource is poor.
World map


Venezuela


Maracaibo, Venezuela 10,39N 71,36W

Mean annual windspeed of 2.86m/s,
this is poor for electricity generation.

North of the equator, mean windspeed is slightly greater in the winter months, reaching 3.81m/s in January to March.

Overall, wind resource is poor although the numerous gravity foundations used by the oil industry in Lago Maracaibo mean the area may become more interesting in future.
World map


North America

North America:

The windspeed is at its lowest to the South, where the Gulf of Mexico has a mean of 6.44 m/s, with windspeed increasing to the North and a high at a latitude of around 55 to 60 degrees North (both the Cook inlet and the Bravo Weathership are at this latitude and have means of 12 m/s and 12.88 m/s respectively). North of this latitude, towards the Arctic circle, the windspeed slows again with Yukon and Nunavut having means of 7.88 m/s and 7.15 m/s respectively.
World map


Gulf of Mexico

Galveston, Gulf of Mexico

With a coastal 100m mean windspeed of 6.2 m/s, this is a fairly low windspeed. Offshore wind might not normally be considered feasible here, if it were not for the fact that the Gulf of Mexico has the worlds greatest concentration of offshore platforms (4000 in this region alone). With this sort of potential for re-use, the Gulf of Mexico becomes much, much more interesting.
World map


California


California

Here we see two mean annual 100m windspeeds.
The first, "California", 7.08m/s, is a near shore windspeed for California, obtained from the "Wind Energy Resource Atlas Of the United States".(Produced by Pacific Northwest National Laboratory).
The second, "San F.", 6.44m/s is a coastal windspeed and was obtained from pilots volume.
The benefit of having two figures for the same region is that it allows us to compare a near shore with a coastal figure.
Here we can see an increase of 10% in windspeed by moving offshore, which is consistent with our expected increase of between 10% and 20%.
World map


Alaska

Cook Inlet, USA, 70,08N 143,38W

This figure, 12m/s, is calculated from the 10 m mean windspeed for the region from the "Wind Energy Resource Atlas Of the United States"(Produced by Pacific Northwest National Laboratory), extrapolated to 100m.

The oilfields around the Cook Inlet have an extremely high wind resource, with great prospects for electricity generation.

In this region and further north into the Arctic circle, the sea freezes during winter which means that any structure in the sea has to be built to withstand the ice.

This could make offshore wind in this region extrememly expensive and thus re-using foundations left by the oil industry may be a useful option.
World map


Yukon


Barter Island, Yukon, Canadian Arctic 70,08N 143,38W

Mean annual 100m windspeed is 7.87m/s.
This is promising for electricity generation from the wind.
Although this measurement is from an island, an anticipated increase in windspeed further offshore seems reasonable.

A single 2MW turbine from NEG-Micon, at this location, could generate more than 6 million kWh per year.
World map


Nunavut (formely known as Northwest Territories)

On April 1st 1999, the new territory of Nunavut came into being, taking in the central and eastern portions of the Northwest Territories. It is a homeland for the Inuit people and has democratic self rule within Canada. Nunavut means "our land" in Inuktitut. We wish them well.

Resolute, Nunavut, Canadian Arctic 74,43N 94,59W

Mean annual windspeed is 7.16m/s.
This is promising for electricity generation from the wind.
Extra care would have to be taken in the design of the machine so that it could withstand the arctic environment.


A 2MW wind turbine here could generate as much as 5 million kWh per year.
World map


Newfoundland, Canada


These three windspeeds are for Newfoundland in Canada. Hopedale is a rig about halfay down Newfoundland and has a 100m mean windspeed of 8.23 m/s. It is between the mainland and some offshore islands and so is probably sheltered from the full Atlantic Winds. "Bravo" is an Ocean Weather Ship Bravo which measured windspeed in the Atlantic; predicted 100m windspeed in the Atlantic off the coast of Newfoundland is 12.88 m/s. Belle Island is in a strait in the south of Newfoundland and has a 100m mean windspeed of 11.45 m/s.
A single 2MW wind turbine in Hopedale could generate about 6.5 million kWh per year.
A single 2MW wind turbine here could generate about 10.5 million kWh per year.
A single 2MW wind turbine in Hopedale could generate about 10 million kWh per year.
World map


Africa

Africa

The offshore oil fields of Africa are located very close to the coasts of Nigeria, Cameroon, Congo and Zaire. Seen here is mean 100m windspeeds for two coastal locations in West Africa, the wind resource here is poor, with Calabar, in Eastern Nigeria, being a good exception.
World map


Nigeria


Calabar, Nigeria 4,58N 8,21E

With a 100m mean annual windspeed of 7.16 m/s, this is one of the regions highest.
If offshore rigs have mean windspeeds of this magnitude, then the prospects for wind turbines are good.
The power they generate could be used to desalinate water either for drinking or for agriculture.
World map


Congo

Pointe-Noire, Congo 4,49S 11,48E

100m mean windspeed measured at Pointe-Noire (4,49S 11,48E) as being 2.86 m/s.
In an region such as this there would not appear to be much scope for generation from the wind.
World map