|
Scenario 3 |
|
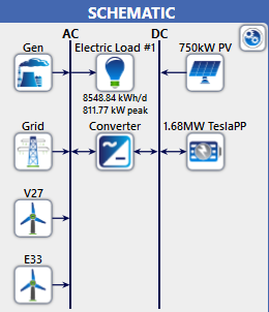
For scenario 3, the large increase in the tourism sector meant that electrical demand during the summer months was much higher than scenarios 1 and 2, or the current system on the island. It was thus beneficial to keep the PV installation of scenarios 1 and 2, but with the installed capacity increased to 750kW in order to allow more of the summer demand to be met by renewables. In order to keep exports within the limit, the installed capacity of lithium-ion batteries also had to be increased, up to 1.68MW. The full schematic of the scenario 3 energy system is shown across.
|
|
|
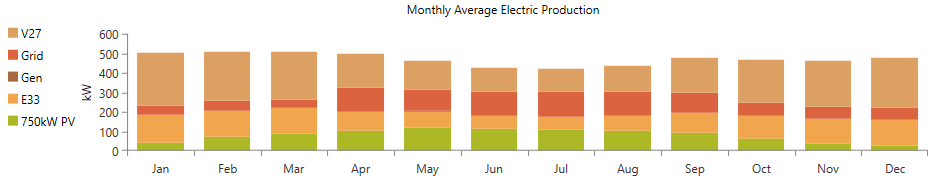
Despite the increase capacity of PV panels, grid imports are still more prominent in summer than in winter, with total generation from renewables being higher in winter and lower in summer. This is evident in the monthly average electric production graph, where the contribution from the grid is noticeably larger in summer months than winter, despire the increased PV output in summer. The increased installed renewable system capacity gives reduced grid purchases compared to scenario 2, however they are still significantly higher than scenario 1.
|
|
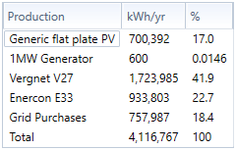
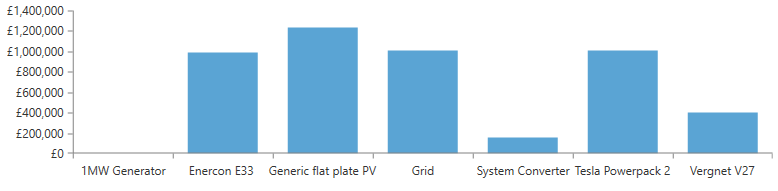
The 750kW PV installation now becomes the largest cost for the islands energy system in this scenario, reaching around £1.2 million taking everything into account. Grid purchases and the battery installation are other significant costs in this scenario, aside from the previously mentioned re-mortaged Enercon turbine.
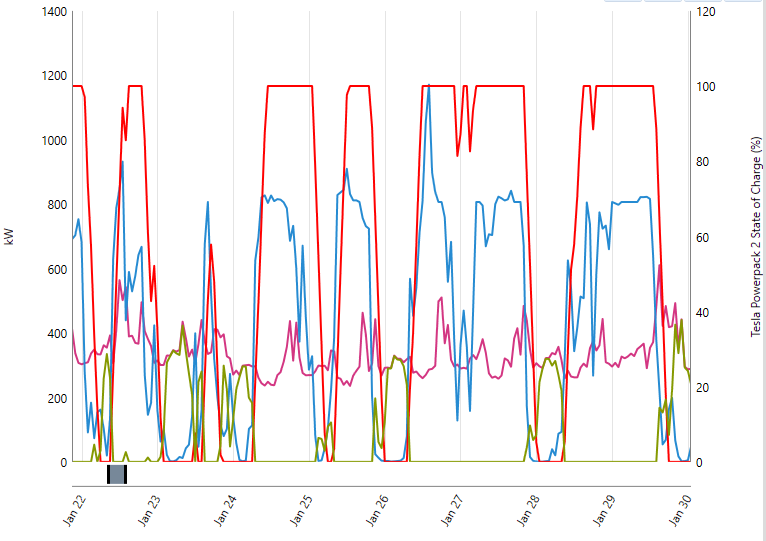
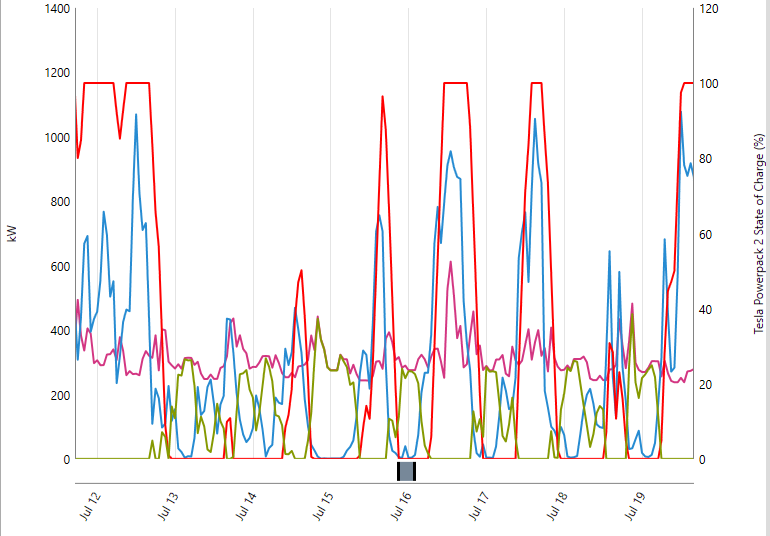
The functioning of the system for a winter and summer week are shown below. Here the system again operates in the same way as scenarios 1 and 2, with excess renewables charging the battery, and grid purchases kicking in when the load cannot be met from renewables or stored energy. The higher amount of renewables generation during the winter is also made evident here, with the area under the blue line being evidently larger in the winter week than the summer. The batteries are also fully charged more frequently in winter than summer, as can be seen in the graph.
|
|
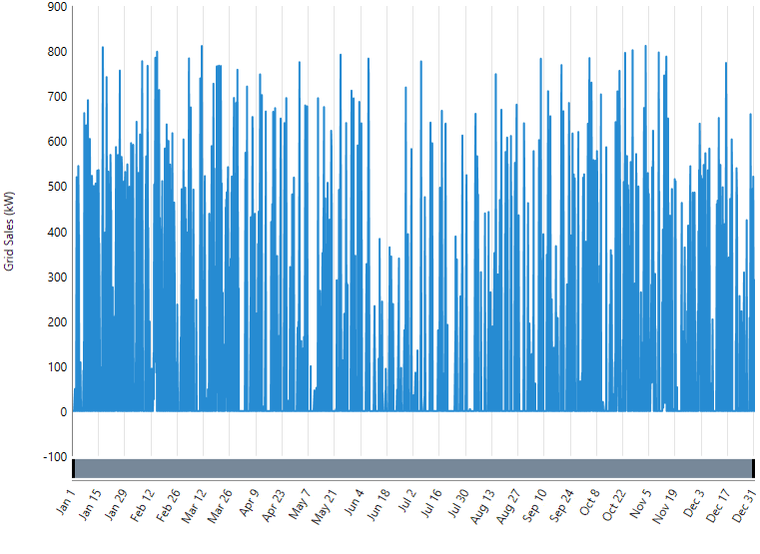
The grid exports for this scenario have a higher peak value than scenarios 1 and 2, sometimes in excess of 900kW. This is still within the 1MW export limit, However, it is closer to the cap compared to scenarios 1 and 2. This could be a potential issue in getting permission for the PV installation, as the utilities company may not want to risk the cable being damage from exports possibly exceeding the cap in the unlikely situation where all installed renewables were operating at close to capacity. To see Scenario 3's carbon footprint, total grid imports and export and economic results, visit the scenario comparison section.