The Fuel cell laboratory
With hydrogen fuel cell vehicle (HFCV) technology being the more developed technology when it comes to using fuel cells for transport purposes or electrical balancing, there are a variety of fuel cell manufacturers that currently exist for HFCVs with a lot of technical documentation available. For our purposes, we required a much larger fuel cell for grid balancing purposes and commercially, these larger fuel cells are less available and difficult to obtain documentation for. Additionally, the University of Strathclyde has a fuel cell laboratory where we could obtain empirical data for the hydrogen consumption of the fuel cell and so obtain the quantity of hydrogen required from the electrolyser (Figure 1).
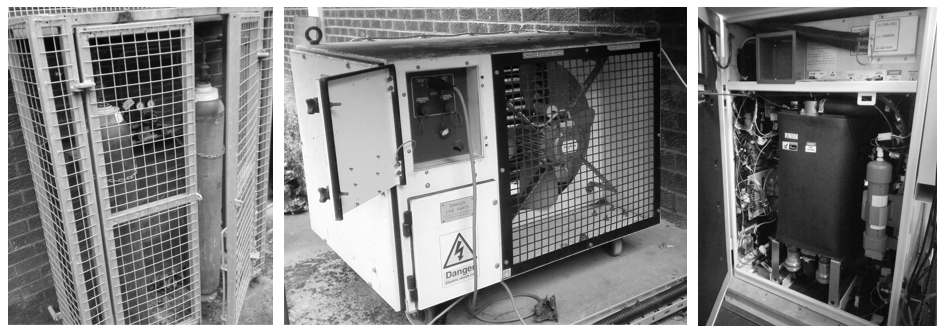
Figure 1. The GenCore Fuel Cell system at the University of Strathclyde. Left: the hydrogen fuel, Centre: a control unit, Right: the fuel cell showing the insulated stacks
The fuel cell is based in the Henry Dyer building at the University of Strathclyde. It is a GenCore Plug Power Fuel cell system with an attached battery pack. Figure 1 shows some of the technical components in the lab. Left are the hydrogen fuel tanks stored at 15 bar, centre shows the control unit for dispensing the hydrogen and right, the fuel cell itself displaying the stack system which is insulated. The fuel cell has a response time of ~1s and the battery a response time of ~1ms and so the GenCore fuel cell system has a fast response time in order to meet grid balancing purposes. [1] The battery only operates to meet the response time of ~1s and so draws very little power from the system. The GenCore fuel cell system has an output of 5 kW. It has 11 stacks within the fuel cell and consumes hydrogen at a pressure of 5.5 bar.
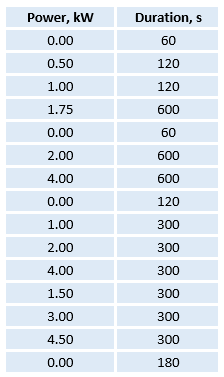
Table 1. Experimental Procedure Designed for the Fuel Cell lab experiment
|
An experimental procedure was designed in order to obtain the rate of hydrogen consumption at a given power output. The fuel cell would be operated at a variety of power outputs and the hydrogen consumption observed. We would change variables to see the effect on the rate of hydrogen consumption.
The variables altered included how long each power output step would last for, changing the power output increments, repeating these results and also measuring the hydrogen consumption of the system when no power output was applied. With these variables in mind, the experimental procedure displayed in Table 1 was created and used to investigate the properties of the GenCore fuel cell. |
The data was collected by the team early on in the group project. The experimental procedure designed and described above was carried out. Power output was varied over time and the corresponding hydrogen consumption was recorded.The results from this experiment are displayed in Figure 2.
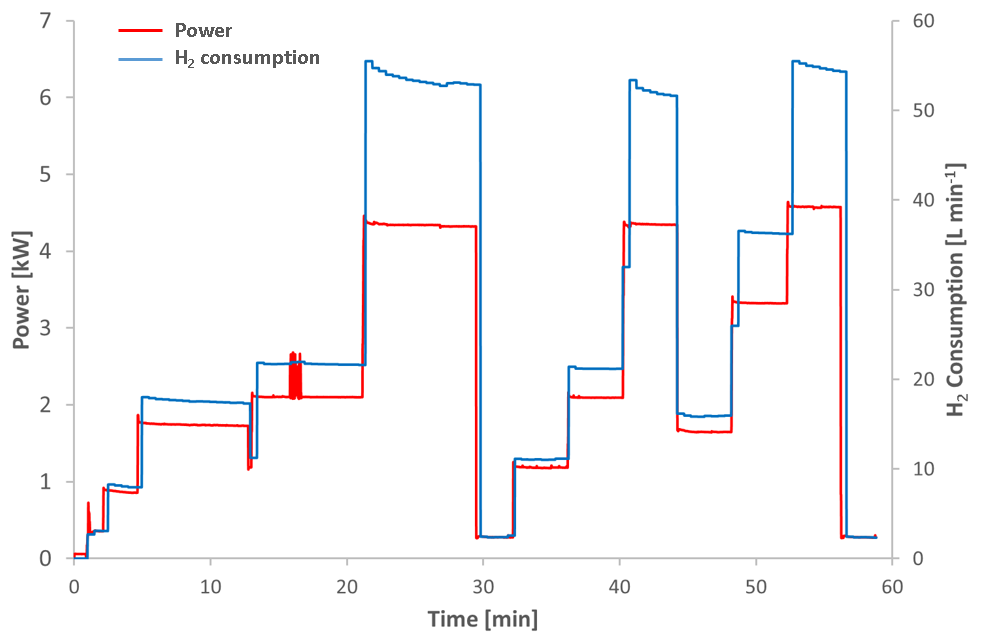
Figure 2. Experimental data collected during the fuel cell investigation showing duration of procedure, power output and hydrogen consumption
It can be seen that as power output is increased, so hydrogen consumption increases. On changing the power output, there is a spike in hydrogen consumption that then declines to a plateau over a short time. Although at higher power outputs, the hydrogen consumption declines slightly more over time than at the lower power outputs. This decline was deemed insignificant by the technical experts in the lab and within an acceptable range for the consumption to be stable. It is worth noting that when there is no power output there is still hydrogen consumption. The results files from this procedure were then combined and the data processed. The power output was plotted against the hydrogen consumption (Figure 3). Insignificant outlying data points have been removed for clarity.
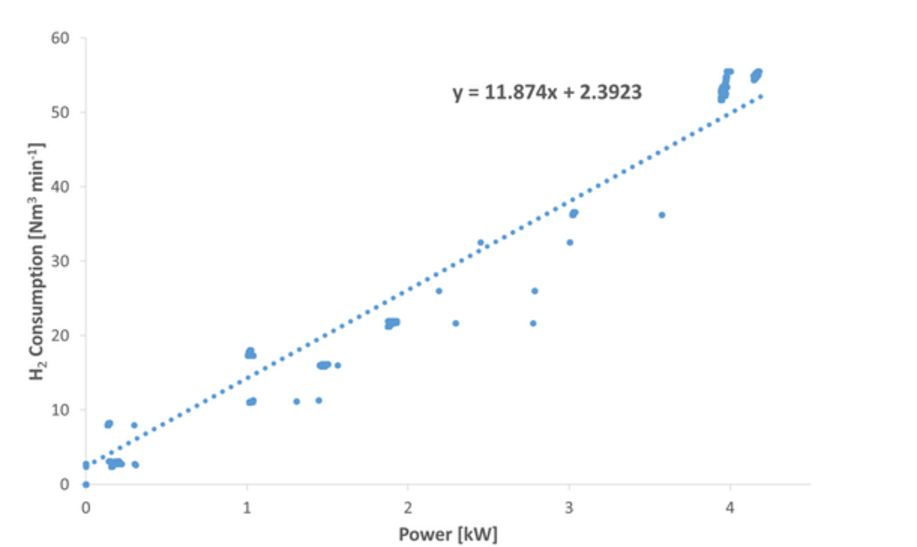
Figure 3. Linear relationship between power output of fuel cell and hydrogen consumption
It can be seen that there is a linear relationship between power output and hydrogen consumption. Therefore a line of best fit was added to the data and a linear equation extrapolated. The equation obtained from the results was y = 11.874x + 2.3923, where x is the power output (kW) and y is the hydrogen consumed in Nm³/min. Due to the fuel cell still consuming hydrogen when there is no power output, the equation does not cross 0 at the y axis.
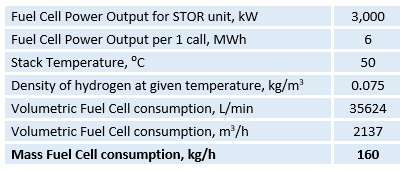
Table 2. Key values required for calculating the hydrogen consumption of a 3MW fuel cell
|
This equation could then be used to determine the hydrogen consumption of a larger fuel cell system. The units for hydrogen were converted from the experimental outputted data of Nm³/min, to kg/h, which is the commonly used unit for electrolyser output. Table 2 shows the key values required for calculating the hydrogen consumption of a fuel cell suitable for providing power in the STOR market (See Project > Short Term Operating Reserve). In this case a store unit of 3 MW is in use for two hours. In this situation, the fuel cell requires 160 kg/h of hydrogen to be generated by the electrolyser
|
System efficiency
By looking at the overall grid balancing process to provide electricity at times of deficit, from electricity at times of surplus using hydrogen as the energy vector, we can calculate the overall system efficiency. We know the desired electrical power output, and working backwards, calculating the hydrogen consumption required by the fuel cell and so the required hydrogen output of the electrolyser, we know the power input required to drive the whole process. Table 3 shows some of the key values required to calculate the system efficiency. The total efficiency was found to be 29 %. This value was found to be similar to that of an analogous system at the Bright Green Hydrogen office in Fife, giving us some validation in our methodology and results. [2]
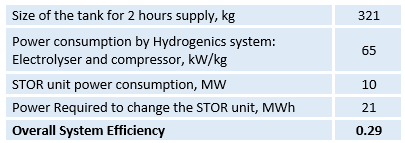
Table 3. Key values for calculating the overall efficiency of producing electricity for the STOR system
[1] GenCore Plug Power Fuel Cell System Operations Manual
[2] Bright Green Hydrogen: http://brightgreenhydrogen.org.uk/
[2] Bright Green Hydrogen: http://brightgreenhydrogen.org.uk/