


Case Studies
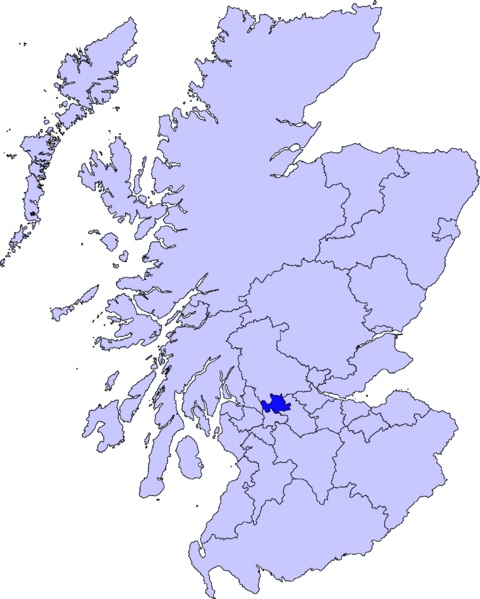
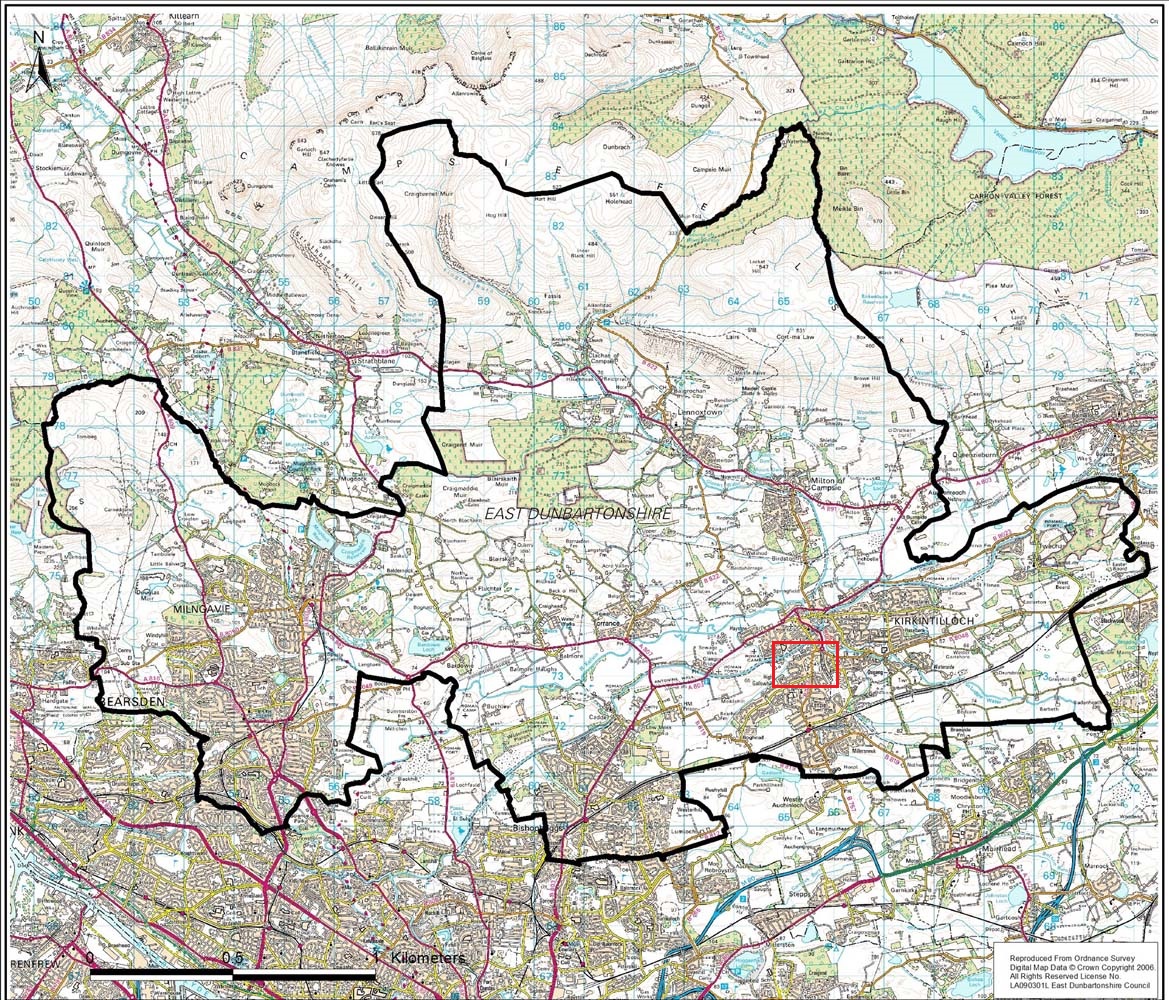
Location
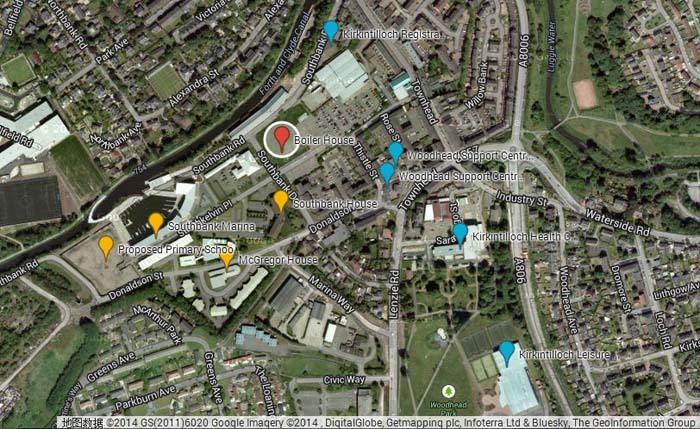
Site One
Site Two
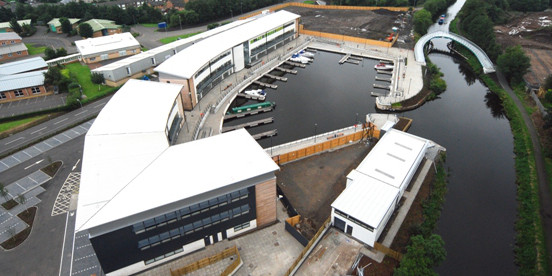
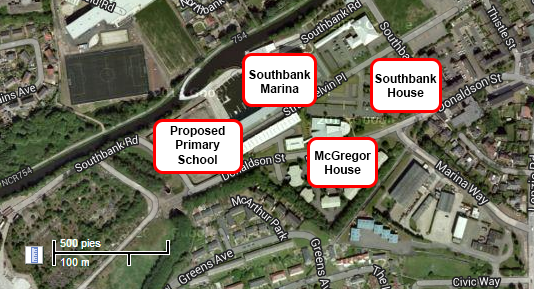
Site One Overview
Base Case
| Building | Fuel | Efficiency |
|---|---|---|
| Southbank Marina | Natural gas | 80% |
| Primary School | Natural gas | 90% |
| McGregor House | Electricity | 70% |
| Southbank House | Natural gas | 65% |
Reasons for Site One selection
The fundamental reasons why each individual building has been selected to be included in the first biomass DH scheme are tabulated below:
| Building | Reasons for Selection in DH Scheme |
|---|---|
Southbank Marina (proposed council HQ) |
|
Southbank House |
|
McGregor House (community centre) |
|
Proposed Primary School |
|
As outlined in the ‘Site Selection’ section of the methodology explanation, all outlined site selection criteria should be met before commencing with a detailed feasibility analysis. In this case, the selection of these four buildings meets all these criteria. The reasons why are tabulated below:
| Initial Site Selection Criteria | Justification of Meeting Criteria |
|---|---|
High Heat Density |
|
Poor Base Case Performance |
|
Access to Required Data |
|
Feasible Piping Network |
|
Potential Energy Centre Location |
|
It was decided to keep the first case-study scheme relatively small. This ensured a manageable feasibility analysis in order to initially test our methodology and design tools. Once the biomass DH network’s buildings had been carefully selected, the demand profile could be generated.
Site One Demand Profile
The Carbon Trust tool’s billing method was used in order to generate the biomass DH thermal load profile. The reasoning behind selecting this method over other options has been outline previously in the section ‘Methodology: Demand Profile’.
Multiple input data related to energy consumption, demands and building properties was required for each individual building in the biomass DH scheme. The tool then used this data to generate a single design day load profile on which the boiler and thermal storage could be sized. An outline of all input data and justification of figures is tabulated below:
| Demand Profile Input Data | Justification of Figures |
|---|---|
Calendar year for which data is available |
|
Degree days at design day |
|
Total fuel consumption at design day |
|
Annual energy consumption |
|
Existing boiler seasonal efficiency |
|
Site location |
|
Outdoor design temperature |
|
Desired internal temperature |
|
Building floor area |
|
Building thermal mass |
|
Level of insulation |
|
Area of glazing |
|
Level of occupancy |
|
Typical occupancy |
|
Casual gains |
|
Ventilation losses |
|
Hot water demand |
|
The generated design day load profile for the biomass DH scheme is shown below;
")
Accuracy
The accuracy of the design day load profile may not be perfect. However, we deem it acceptable for a high-level feasibility analysis of biomass DH for this given scheme. All input data into the carbon Trust tool has been justified and decided upon based on consultation with the experienced Campbell Palmer Partnership, East Dunbartonshire Council, site visits and relevant technical guidelines and benchmarks. As previously stated, modelling existing buildings is challenging for a multiple of reasons. We believe that this level of detail is adequate to continue the feasibility analysis process.
References
Jones, P., 2004.
Energy-efficient boilers & burners. Building Energy Solutions,
2(July/August), p.4.
Site One Boiler & Storage Analysis
Biomass boiler
The strategy used to size the system was the ‘Optimum boiler and thermal storage combination’ so that the size of the biomass boiler can be reduced for better operation when loads are low. The size of the thermal storage is not limited since the boiler house is new and therefore, its size can be defined.
A back-up boiler that can meet nearly 100% of the peak demand is selected in case there is a failure in the biomass boiler. This back-up boiler will run with natural gas, with an efficiency of 90% and will be 1.5 MW.
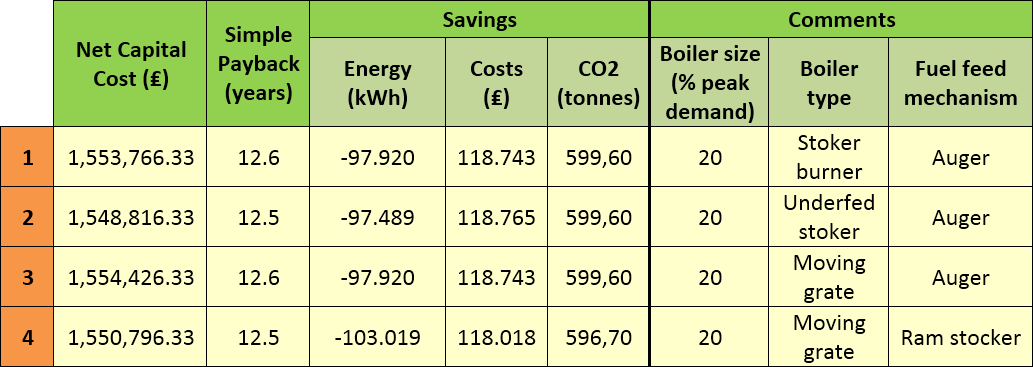
Different boilers have been selected in order to do a comparison. Changes were made to:
- Type of the boiler: stoker burner, underfed stoker and moving grate.
- Type of feeding system: auger and ram stoker.
- Size of the boiler: to meet 80% (1.2 MW), 50% (750 kW) and 20% (300 kW) of the peak demand.
Results are shown below:
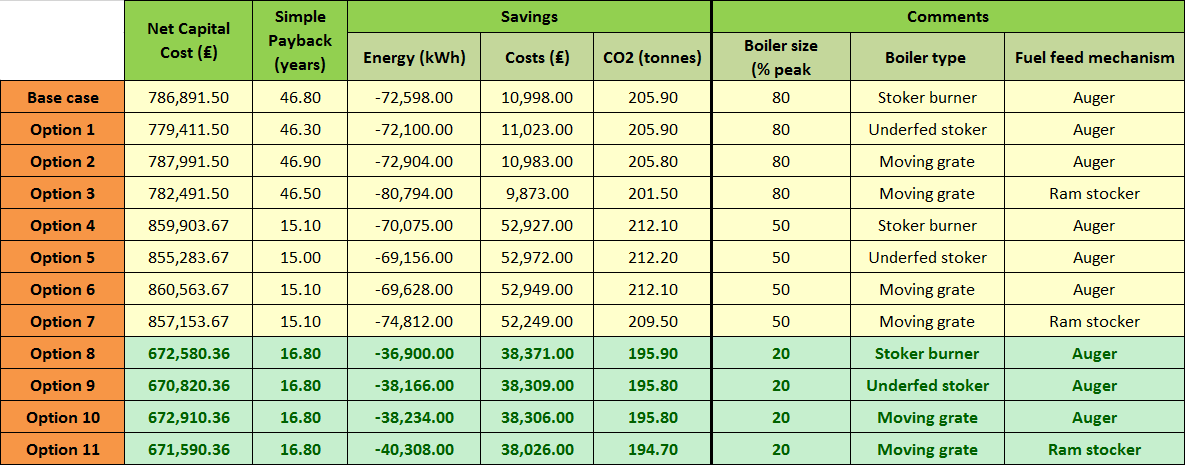
From the results above, it can be seen that the best options are those that use a 300 kW boiler to meet 20% of the peak demand. The final option chosen was option 9, with the underfed stoker boiler and the auger feeding system as this option gives the smallest capital cost.
It is needed to make clear that these results are only used to compare different boiler options but are not the final ones since changes to thermal storage and fuel types were made afterwards.
Thermal storage
Once the thermal storage is sized, it can be implemented using one or several vessels. In this project, one, two, three and four vessel configurations were analysed. Results obtained show that the best option is to have only one vessel because the thermal losses are lower as the external surface decreases. However, this result is not realistic as the tool calculates the costs of the thermal storage based only on the total volume and not in the number of vessels.

In addition to the size and number of vessels to be used, vertical and horizontal configurations can be analysed, as well as their location (inside or outside the boiler house). As explained in section 3, stratification is an advantage because it leads to energy savings. Therefore, vertical configuration is chosen. Finally, as the thermal storage required depending on the size of the boiler, varies from 37,000 to 99,000 litres, the thermal storage will be outside the boiler house.
After this analysis, a better strategy was used. Once the thermal storage is sized as 99,000 litres, it can be implemented using vessels of 5,000 and 10,000 litres, because those sizes are the most commonly used. A further analysis was carried out decreasing the size of the thermal storage in order to find the best option, even though it would not be the ‘Optimum size’ according to the tool. Results are shown below:

From the results above, it can be seen that as the size of the thermal storage decreases, so does the capital cost and the payback period, giving therefore better results. However, the percentage of energy coming from biomass, and thus, the CO2 savings also decrease. Finally, the best option, according to the weighting process explained in the methodology, is a thermal storage of 10,000 litres.
Site One Fuel Type Analysis
As explained in the methodology, biomass fuels are typically delivered as wood chips or wood pellets so these are the options that were analysed. Two types of wood pellets and wood chips have been selected from local suppliers near Kirkintilloch. The main characteristics of these fuels are shown below:

Results from the Carbon Trust tool show that wood chips are the best option. This is mainly due to the price of wood chips compared to wood pellets. However the tool does not take into account other factors such as fuel feeding and storage, which are less complicated when using wood pellets as discussed in the previous section. Thus, wood pellets are finally selected due to their advantages against wood chips.
References:
http://www.woodfueldirectory.org
http://www.puffinpellets.com/Blown_Deliveries.html
http://pentlandbiomass.com/wood-pellets/brites-wood-pellets
http://www.forestfuels.co.uk/about-wood-fuel/fuel-price-comparisons
Site One Piping Network
Pipe Sizing
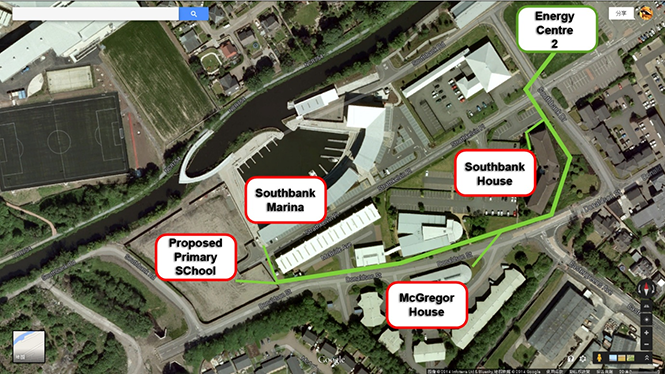
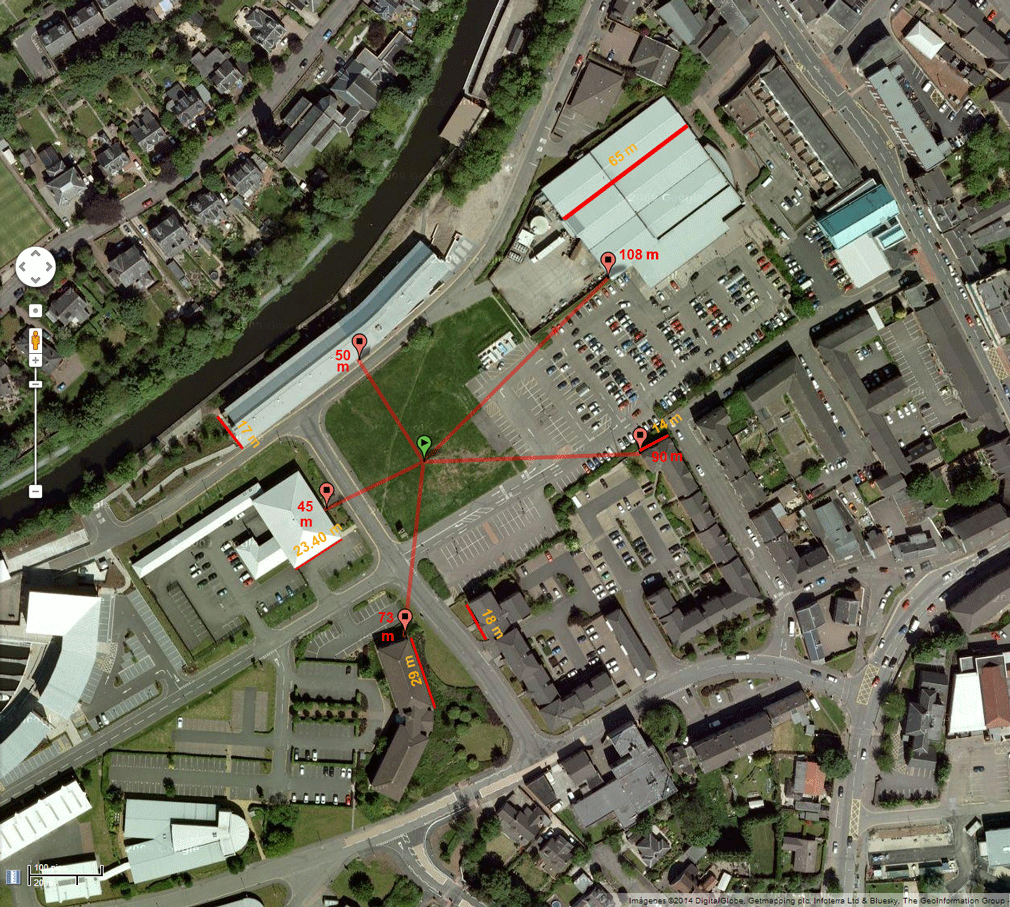
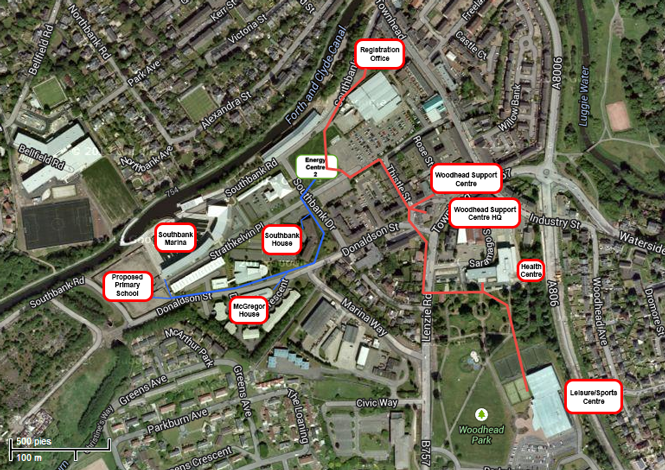
For the Site 1 Case Study we have analysed two different Energy Centre locations on both sides of the buildings locations. Energy Centre 1 situated to the left of the Proposed Primary School while Energy Centre 2 is NE of the Southbank House. For each of the Energy Centre we have evaluated two different piping layouts to be able to determine which one was most likely to have the lower heat distribution costs, and therefore we have calculated the associated piping and pumping costs to decide upon the best option.
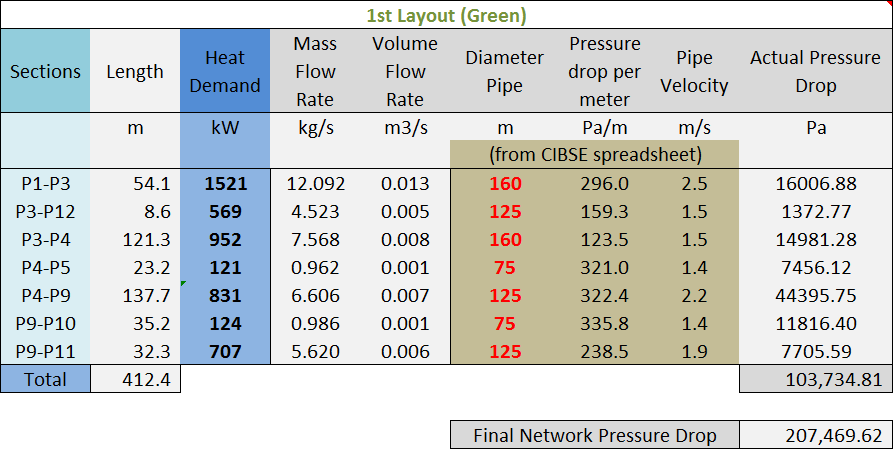
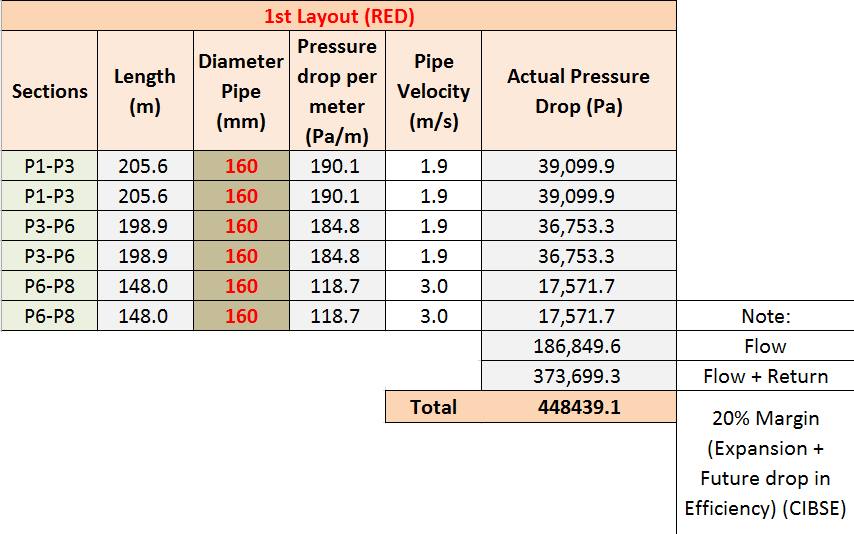
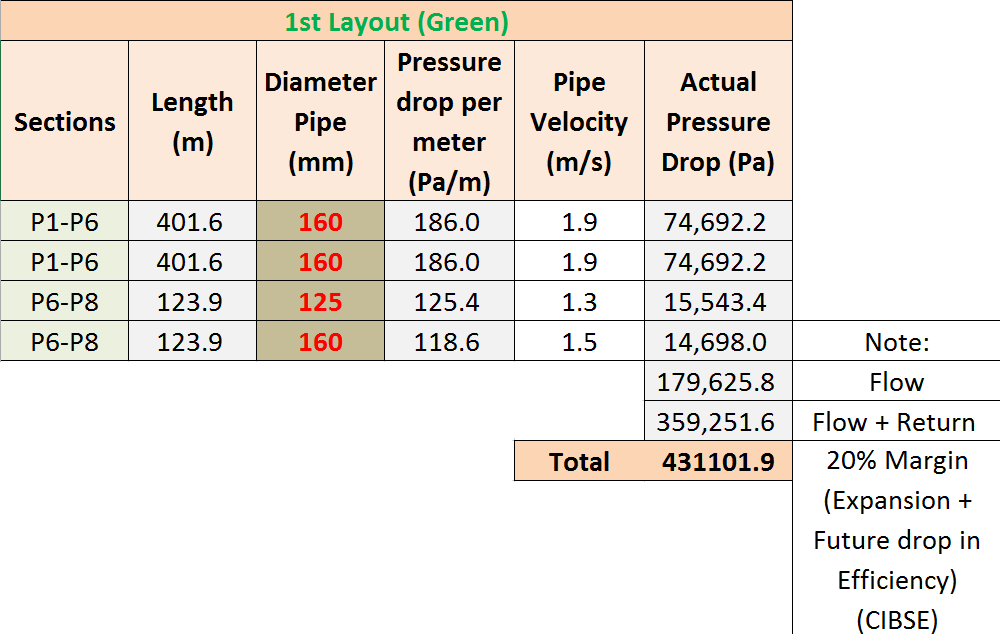
In this section the pipe sizing example is shown for the Energy Centre 2 location and the green layout to depict how the methodology was applied to our particular case studies.
We have selected a supply temperature of 90°C and a return of 60°C.
The chosen pipe material is high-pressure cross-linked polyethylene (PE-Xa). The main reasons for choosing this instead of steel being its reduced costs and capabilities to bend, reducing the need for fittings. Manufacturers recommended it for diameters lower than 160 mm.
The manufacturer’s data used was from REHAU supplier RAUTHERMEX UNO pipe model, with nominal diameters ranging from 25 to 160 mm (see below figures):


The overall peak demand for this case study is 1521 kW with the proposed primary school being our highest load with 707 kW while Southbank Marina and McGregor House are lowest with 124 and 121 kW respectively.

Following the process explained in the methodology we, calculated the diameter required for each piping section. Because we have a supply and return flow we had to obtain the final pressure drop. Results can be seen below.
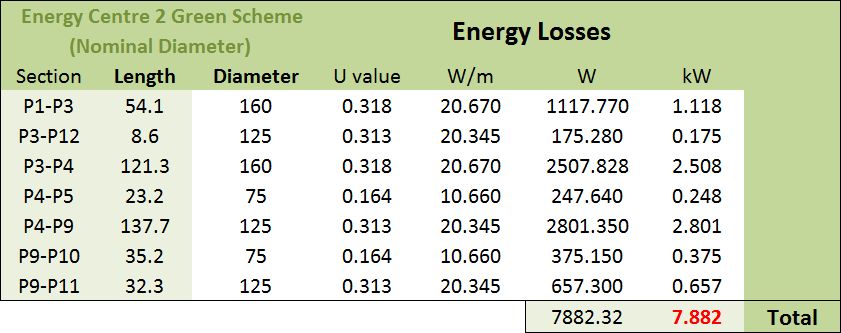
With the previous diameter, we calculated the heat losses associated with each section following the explained procedure in the methodology section. For the Energy Centre 2:
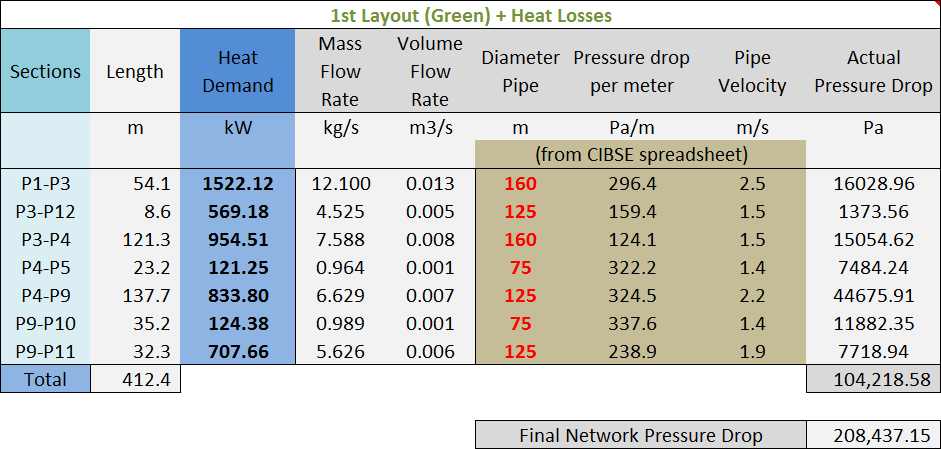
Adding the heat losses for each section to the previous heat demand we repeated the diameter selection process:
This process was followed for each of the 2 layouts for the 2 Energy Centre locations and then pumping cost were calculated for the ones with the lowest pressure drop on each location.
Pipe Cost
Following the methodology, piping costs were calculated according to the type of land area that needed to be trenched to deploy the piping.

Pump sizing
The pump sizing process for the case study follows that outline in the methodology, Key Processes: Pump Sizing. The full process for the Green piping layout for boiler house location 1 is outlined as follows;
The index pressure run, based on pressure losses and mass flow rates from corresponding cumulative building heat loads, is tabulated below:

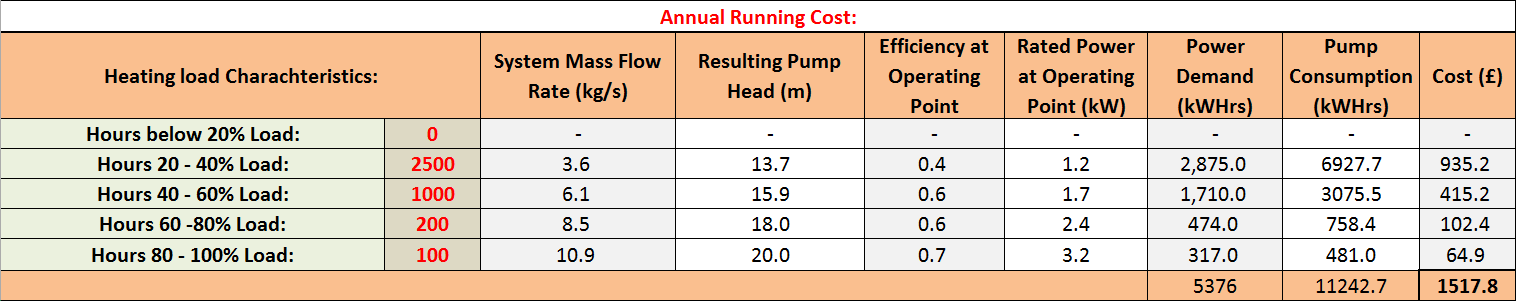
From this data, the pump could be sized based on the required pump characteristics. The pump would be required to deliver a mass flow rate of 12.1kg/s and 22.4m of static head under design conditions. From this information, the Grundfos tool was used to select the best match. The manufacturer then provides sufficient information to perform a cost analysis for the pumping operation within the network. This includes required pump curves.
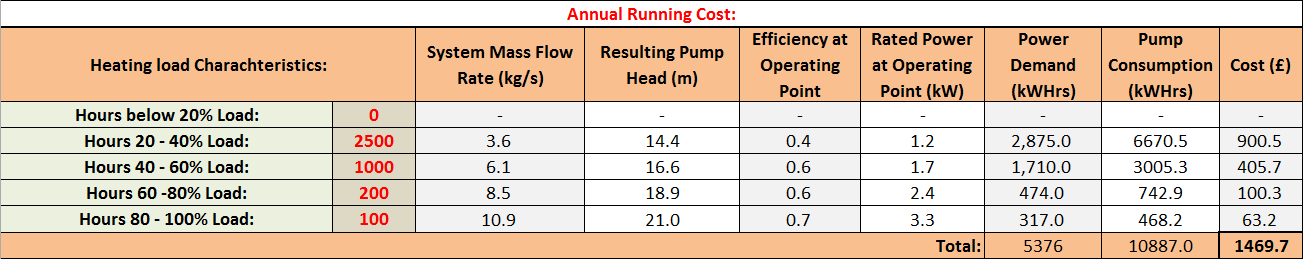
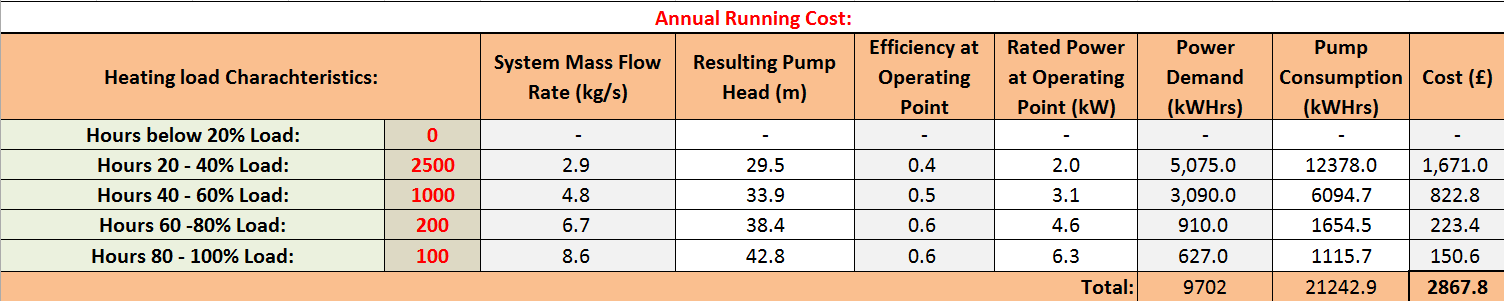
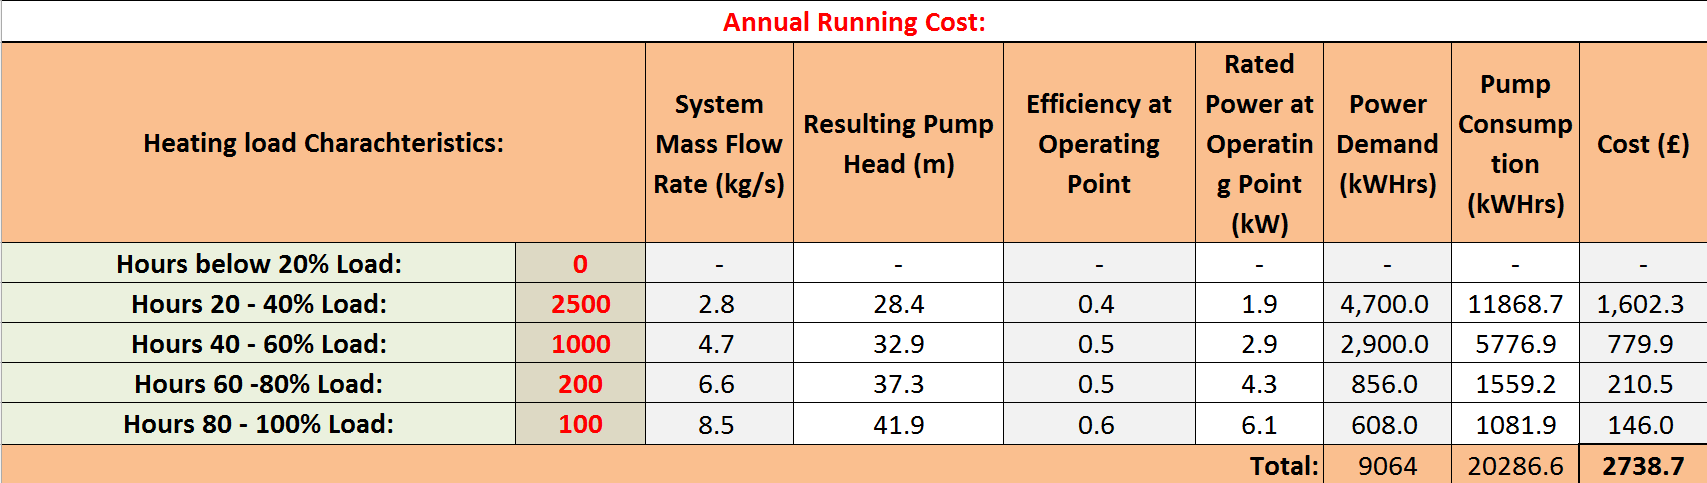
Pump Costs
The annual pumping running costs for the distribution network has been tabulated below. This has been calculated using the methodology outline previously. This process utilised both pump manufacturers data and the Carbon Trust tool in order to get accurate results for the feasibility analysis.
The capital costs of the required pumps are seen below. This is easily obtained via the manufacturer.

The same process has been applied to the Red piping layout of boiler house location 2. The results for this are indicated below.

All pumping calculations and analysis have been performed for two potential boiler locations, each with two potential piping layouts. Only the two provided here as shown as they were the two to be considered feasible, based on piping construction costs earlier outlined.
Best Piping Network
In this section we have compared each Energy Centre locations associated costs in order to select and recommend the best options (see summary table below):

Even though the Energy Centre 1 Red layout was the one with the lowest costs, we have considered that the Energy Centre 2 was a better location. Its possibilities for growth were higher as it was near to new buildings that could be added to the network and the capital cost difference was not significant (less than 15% higher). To add to this, it is located further away from the primary school and would be on council owned land. These planning permission reasons must also be considered when recommending a boiler house location.
Site One Environmental Analysis
After performing the boiler size and system layout and following the Clean Air Act, our District Heating emissions needed to be assessed. Our Energy Centre output was 300 kW. According to the Environmental Protection UK (EPUK) guidelines and following the tasks explained in the methodology section: 
- Average annual background concentration obtained from the Local Air Quality Management section of The Department for Environment Food and Rural Affairs (DEFRA). Kirkintilloch maps are within the 1km grid square 265500 (x), 673500 (y). Summary results for the period from 2014 to 2130 are shown right:
- Annual mean contribution for particulate and NOx calculated for an Energy Centre of the following characteristics:
- The flue stack height of 11 m and 19 m width, implying that building within a distance of 55 m would have an effect on the calculations. A distance map was created showing the main building height and width.
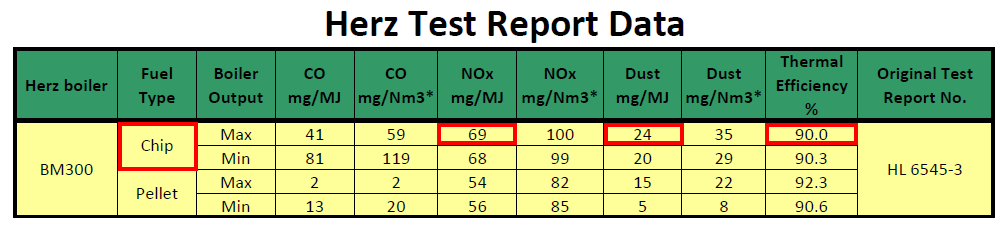
- Test Report Data was used for the 300 kW boiler and wood chips, rather than pellets, as fuel as they are the worst case scenario. Results are shown under the EPUK Screening Tool column in the summary table at the end of this section.
- The flue stack height of 11 m and 19 m width, implying that building within a distance of 55 m would have an effect on the calculations. A distance map was created showing the main building height and width.
- Aggregated values were then obtained for the 300 kW biomass boiler and contrasted against the Air Quality Standards for Scotland. It showed that our system with this particular Energy Centre configuration would not have problems regarding PM and NOx emissions. Both values are below the 40 µg/m3 limit for both pollutants.

Sensitivity Analysis
A sensitivity analysis has been performed to address how our boiler size decision would have an effect on District Heating feasibility in our case studies. To do this calculations were conducted for sizes ranging from 250 kW up to 975 kW, as explained in the methodology section, according to reference data and the preliminary analysis of our schemes. The summary table, for the 11 m stack height Energy Centre, could be seen below:
To analyse how our system could be affected by the height of its chimney the previous calculations were conducted for 9, 10 and 11 m height. The impact could be seen in the below graph: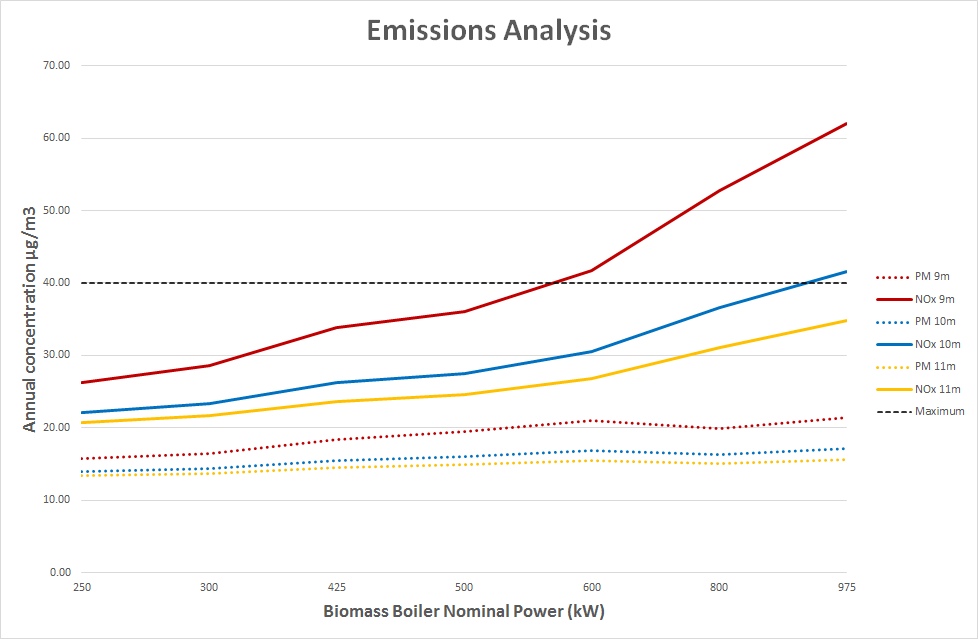
After assessing our system we have confirmed that dispersion of pollutants is highly affected by the difference in height between the energy centre stack and the surrounding buildings height.
References
Abbott, J., 2008. Technical Guidance: Screening assessment for biomass boilers.
EPUK, 2010. Biomass and Air Quality Guidance for Scottish Local Authorities.
http://laqm.defra.gov.uk/review-and-assessment/tools/background-maps.htmlhttp://www.environmental-protection.org.uk/committees/air-quality/about-air-pollution/air-pollution-sources
http://www.environmental-protection.org.uk/committees/air-quality/air-pollution-law-and-policy/european-air-quality-laws
Site One Sensitivity analysis
The sensitivity analysis is divided into two areas: financial and demand. On the financial front, the main considerations are:
- Piping capital cost due to the uncertainty of this cost.
- Fuel inflation rate for both gas and biomass since a change on the inflation rate of the fuels can cause the system to be unfeasible.
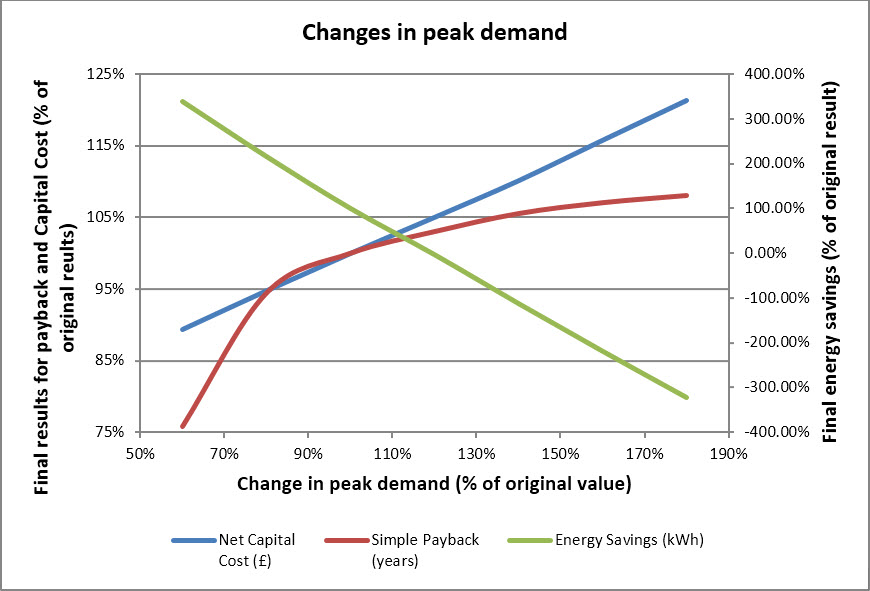
On the demand side, the main considerations are:
- Peak and annual demand since the weather and consumption patterns from one year to another usually varies.
- Efficiency of the base case to take into account possible upgrading of the existing buildings analysed.
The results obtained show that the fuel (biomass and gas) inflation rates do not affect the final result. However, a rise of the piping capital cost leads to the increase in the payback period and obviously, the total capital cost (see graph below).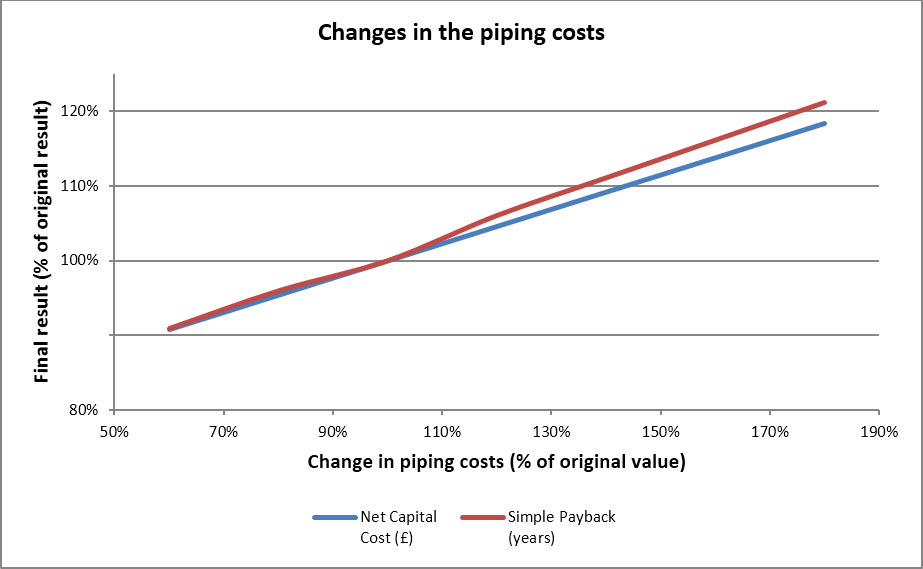
For the demand, a growth in demand shortens the payback period as there are more savings of energy, operating costs and CO2 emissions. It should be noted that, peak demand growth alone will delay the payback since the energy consumption increases. This could be explained taking into account that as the peak demand increases in comparison to the annual demand, a greater boiler size is needed to meet the peak load and there will be more time during the year when the demand is low and the boiler does not operate efficiently.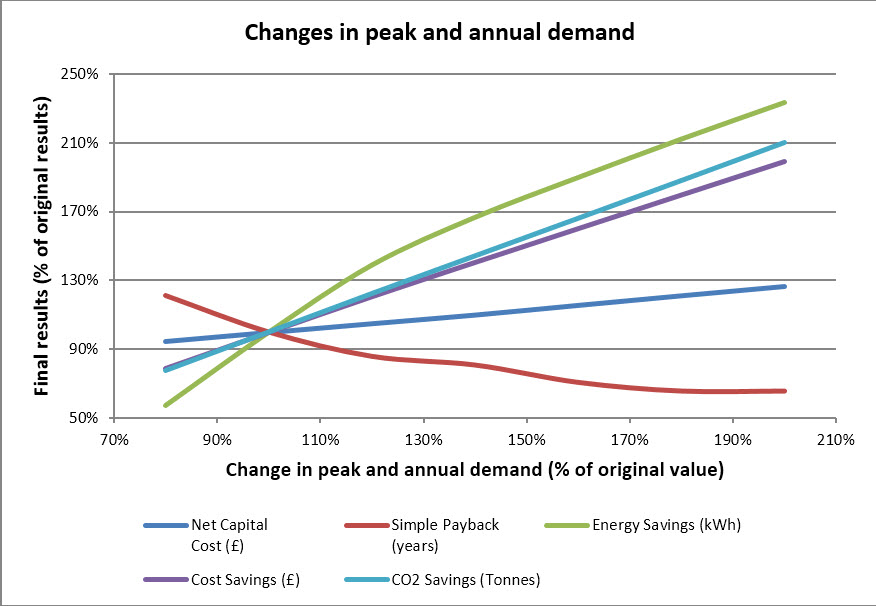
Site One Results Summary

Site One Recommendations
From the analysis that has been carried out, the recommendations for this site can be summarised in the following options:
- Boiler: 300 kW; underfed stoker
- Feeding system: auger
- Thermal storage: 10,000 litres
- Fuel type: wood pellets
- Energy centre location: BH2
Site Two Overview
Base Case
| Building | Fuel | Efficiency |
|---|---|---|
| Southbank Marina | Natural gas | 0,8 |
| Primary School | Natural gas | 0,9 |
| McGregor House | Electricity | 0,7 |
| Southbank House | Natural gas | 0,65 |
| Kirkintilloch Registration Office | Natural gas | 0,66 |
| Woodhead Support Centre (15 Donaldson Place) | Natural gas | 0,66 |
| Woodhead Support Centre (12 Donaldson Place) | Natural gas | 0,66 |
| Kirkintilloch Health Care Centre | Natural gas | 0,8 |
| Kirkintilloch Leisure Centre | Natural gas | 0,9 |
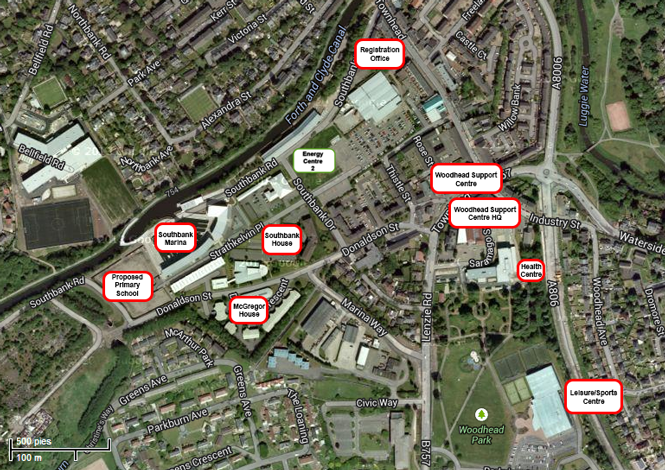
Reasons for Site Two Selection
A second site was chosen to analyse within the same case study. The buildings chosen to be included are highlighted on the map above.
This was performed for a number of reasons:
- To provide more rigorous testing of the designed methodology and accompanying design processes. Proving it can be used on any site.
- To assess the case study location in more detail, providing the council with a more comprehensive feasibility analysis
- To compare two different potential schemes against one another and determine if more generalised conclusions to biomass driven DH can be drawn
- To analyse new and different building types
For these reasons, it can be shown that performing a second site feasibility analysis is not just a repeat of the first. It is an essential part in completing the project objectives and deliverables.
It was decided that the original four buildings should remain in any potential biomass DH scheme for Kirkintilloch. This was due to their selection suitability outlined previously. A further five buildings were carefully selected to be included in a biomass DH high-level feasibility analysis. The reasons for the inclusion of each of the buildings in a potential biomass DH network have been tabulated below:
| Building | Reasons for Selection in DH Scheme |
|---|---|
Kirkintilloch Registration Office |
|
Woodhead Support Centre 1 |
|
Woodhead Support Centre 2 |
|
Kirkintilloch Health Care Centre |
|
Kirkintilloch Leisure Centre |
|
As outlined in the ‘Site Selection’ section of the methodology explanation, all outlined site selection criteria should be met before commencing with a detailed feasibility analysis. In this case, the selection of these nine buildings meets all these criteria. The reasons why are tabulated below:
| Initial Site Selection Criteria | Justification of Meeting Criteria |
|---|---|
High Heat Density |
|
Poor Base Case Performance |
|
Access to Required Data |
|
Feasible Piping Network |
|
Potential Energy Centre Location |
|
Site Two Demand Profile
As with the previous site analysis, all input data into the Carbon Trust tool has been justified and decided upon based on consultation with the experienced Campbell Palmer Partnership, East Dunbartonshire Council, site visits and relevant technical guidelines and benchmarks. The Carbon Trust tool’s billing method was used in order to generate the biomass DH thermal load profile.
The generated design day load profile for the biomass DH scheme is shown below;
")
Site Two Boiler & Storage Analysis
Biomass boiler
As with case study 1, the strategy used to size the system was ‘Optimum boiler and thermal storage combination’ so the size of the biomass boiler can be reduced for a better operation when loads are low. The size of the thermal storage is not limited since the boiler house is new and its size can be defined.
A back-up boiler that can meet nearly 90% of the peak demand is selected in case there is a failure in the biomass boiler. This back-up boiler will run with natural gas, with an efficiency of 90% and will be 3.5 MW.
Different boilers have been selected in order to do a comparison. Changes were made to:
- Type of the boiler: stoker burner, underfed stoker and moving grate.
- Type of feeding system: auger and ram stoker.
- Size of the boiler: to meet 80% (3.1 MW), 38% (1.5 MW) and 20% (800 kW) of the peak demand.
From the results, it was seen that the best options are those that use an 800 kW boiler to meet 20% of the peak demand. The final option chosen was option 2, with the underfed stoker boiler and the auger feeding system as this option gives the smallest capital cost (see the table below).
Thermal storage
In the case study 1, one, two, three and four vessel configurations were analysed. This time, a better strategy was used.
Once the thermal storage is sized as 130,000 litres, it can be implemented using vessels of 5,000 and 10,000 litres, because those sizes are the most commonly used. The analysis was carried decreasing the size of the thermal storage in order to find the best option, even though it would not be the ‘Optimum size’ according to the tool.
From the results, it was seen that as the size of the thermal storage decreases, so does the capital cost and the payback period, giving therefore better results. However, the percentage of energy coming from biomass, and thus, the CO2 savings also decrease. Finally, the best option, according to the weighting process explained in the methodology, is a thermal storage of 75,000 litres (see the table below).

Site Two Fuel Type Analysis
As with case study 1, two types of wood pellets and wood chips were selected from local suppliers near Kirkintilloch.Results from the Carbon Trust tool show again that wood chips are the best option due to their price. However, due to the advantages of wood pellets against wood chips discussed previously, wood pellets were finally chosen.
Site Two Piping Network
Pipe Sizing
For the Site 2 Case Study we have analysed two different layouts for the Energy Centre 2 location. This was determined to be the best option at the end of case study 1 analysis. In this case the best layout would be then added to the one of the first study to confirm the final layout.
In this section the pipe sizing example are shown for the red layout in order to depict how the methodology was applied to our particular case study. In location pictures the previous layout is shown in blue to avoid confusion.
Supply and return temperatures as well as the pipe material are the same as the ones for the previous case study (90°C - 60°C and PE-Xa).
The overall peak demand for this new layout is 2417 kW (3938 kW in total when added to the previous case study) with the Leisure centre being our highest load with 1858 kW while both Woodhead Support Centre 1 and 2 being the lowest with 26 and 11 kW respectively.

Following the process explained in the methodology, we calculated the diameter associated with each section. In this particular case due to our demand being so high PEX piping reached their limits in some sections. For those we decided to split the layout to maintain the diameter within the supplier’s boundaries. Other option would had been to considering changing the material to steel for those sections and check for possible fittings to joint both materials. Because we have a supply and return flow we had to obtain the final pressure drop. Results can be seen below:

With the previous diameter we calculated the heat losses associated for each section following the explained procedure in the methodology section. For the Energy Centre 2:

Adding the heat losses for each section to the previous heat demand we repeated the diameter selection process.
This process was followed for each of the 2 layouts for the Energy Centre location and then pumping cost were calculated taking into account the actual pressure drop. Notice that because some sections were divided we had to consider that in the cost calculation:

Pipe Cost
Following the methodology, piping costs were calculated according to the type of land area that needed to be trenched to deploy the piping:
Pump Sizing
All pumping calculations and analysis have been performed for the two potential pipe layouts for the second site. This followed the same method outlined in the site one Pump Sizing and Pump Costs, hence it has not been outlined in detail again. The results may be seen below.
Red Layout:
Green Layout:
Pump Cost
Red Layout:

Green Layout:
Best Piping Network
In this section we have compared for each Energy Centre location the associated costs of the best options (see summary table below):

Site Two Environmental Analysis
See Environmental Analysis of Case Study 1.
Site Two Sensitivity analysis
The sensitivity analysis is based on the same parameters already explained in the case study 1. Results show the same trends and thus, same conclusions can be made.
Site Two Results Summary

Site Two Recommendations
From the analysis that has been carried out, the recommendations for this site can be summarised in the following options:
- Boiler: 800 kW; underfed stoker
- Feeding system: auger
- Thermal storage: 75,000 litres
- Fuel type: wood pellets
- Energy centre location: BH2
1.2
jQuery, Javscript files, CSS files, images, examples and instructions.
Changelog
- 14.11.2007
- Fixed: alert on key press
- New options: preload - choose when the images are preloaded, on document load or on click
- 13.11.2007
- New option: className - allows you to have diferent styles on the same page
- New option: controlsTrigger - show caption and controls when the mouse is over the image or when the image is focused
- New option: onFocus - callback triggered when the image is focused
- Fixed: keyboard navigation on Safari
- 12.11.2007
- The first release release.