

| Tidal Principles |  |
Tidal patterns Spring and neap tides Tidal currents Current variations
Power output Rule of twelfths Observations References
Tidal patterns
The source of "marine current" or "tidal stream" energy is the tide. When we talk of marine current, we are referring to a moving mass of water with a velocity and direction.
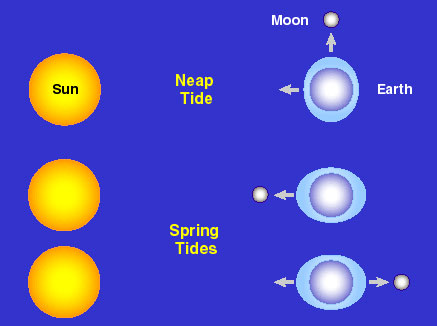
Tides and tidal currents are generated by gravitational forces of the sun and moon on the earth's waters. Due to its proximity to the earth, the moon exerts roughly twice the tide raising force of the sun.
The gravitational forces of the sun and the moon create two "bulges" in the earths oceans: one closest to the moon, and other on the opposite side of the globe. These "bulges" result in the two tides (high water to low water sequence) a day - the dominant tidal pattern in most of the world's oceans.
This is known as a semi-diurnal tide.
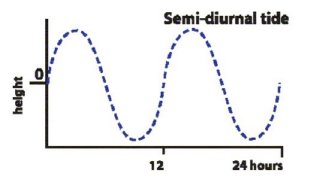
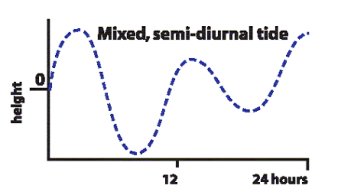
However, normally the tidal behaviour is not as simple the model on the right, instead behaving similarly to the example below.
As the axis of the earth is tilted at 23.5 degrees to the moons orbit, the two bulges are not equal unless the moon is over the equator.
This difference in tide height between the two daily tides is called the diurnal (or declinational) inequality. This repeats on a 14 day cycle as the moon rotates around the earth.
One cycle of high water to low water takes an average of 12.4 hours, although there are occasional variations resulting in a lengthening or shortening of this time.
These variations have been analysed to understand the impact they might have on our tidal model, so that any resultant error can be incorporated into later calculations.
back to top
Spring and neap tides
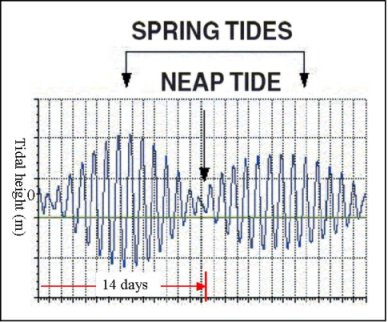 Spring tide is the very highest and very lowest tide (i.e. the largest tidal range) which occurs
twice a month (every 14/15 days) when the moon is either new or full (when the gravitational
pull of the sun and moon is aligned).
Neap tides are the opposite of the spring tide. The tidal range between high and low water is
smallest and occurs nearest the time of the first and last lunar quarters. The ratio of springs
to neaps can be as much as 2 to 1.
Spring tide is the very highest and very lowest tide (i.e. the largest tidal range) which occurs
twice a month (every 14/15 days) when the moon is either new or full (when the gravitational
pull of the sun and moon is aligned).
Neap tides are the opposite of the spring tide. The tidal range between high and low water is
smallest and occurs nearest the time of the first and last lunar quarters. The ratio of springs
to neaps can be as much as 2 to 1.The combination of the spring to neaps cycle and the 14 day diurnal tidal cycle results in a variability of the tides through the months of the year. There are more than a hundred harmonic constituents (cyclic components) of the tide, each with a different cycle time. These constituents combine so that tides only completely repeat themselves every 18.6 years.
A 14 day analysis was implemented to assess the impact of this variation on power output from the turbines.
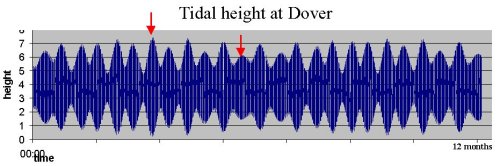
Spring tide maximums vary throughout the year, as can be observed on the graph above predicting tidal heights for Dover 2004.
For this reason, an average spring value is used.
back to top
Tidal currents
Many of the strongest tidal currents are located in shallow waters or through narrow channels that connect large areas of water - hence the coastline and islands of the West of Scotland are an ideal location for exploiting tidal currents.
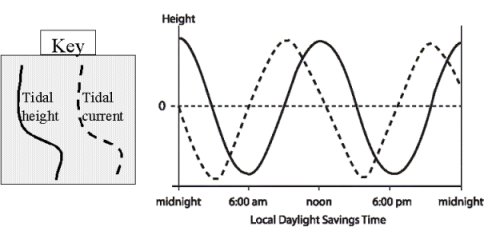
The picture on the left shows the relationship between tidal current (the dashed line) and tidal height (the solid line).
Halfway between high water and low water is usually where the speed is at it's highest. The speed will be zero during the slack water at high and low water (the peaks and troughs in the diagram).

In open water, the flow depends on the direction of the tidal wave.
In channels, the current is constrained to flow either up or down the channel.
As you can see from the animation of tidal behaviour in the Cook Straight in New Zealand on the left, the currents change direction as we move from flood (tide in) to ebb (tide out).
back to top
Current variations
The predicted tidal pattern can be modified by two factors, shown below:
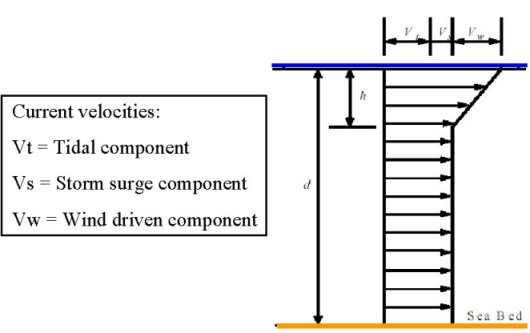
- Wind acting on the sea surface Vw - only has an impact to a certain depth below the surface.
- Atmospheric pressure causing storm surges Vs.
Wind acting on the sea surface may be an important consideration in exposed areas in winter months (depending upon turbine depth and the corresponding barometric pressure).
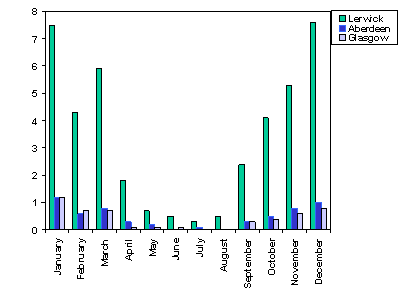
The graph on the left for the 30 year average number of days with gales (1961 to 1990) at some typical Scottish locations below shows how wind speeds can vary substaintially throughout the year.
Wherever possible, turbines will need to be located below the area of influence of the wind component of the current.
A third factor to consider is slack water. This is the period of quiet water when the tide reverses from flood to ebb or vice versa. The duration of slack water will vary, depending upon location and time of year. The tide change from flood (tide in) to ebb (tide out) is referred to as high water slack. The tide change from ebb to flood is termed low water slack.
back to top
Power output
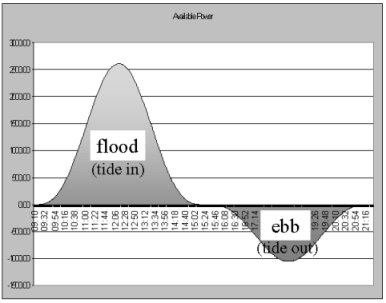
In the image on the right, the potential power out from the flood and the ebb is shown.
The flood stream is normally stronger than the ebb, although the difference is less marked at neaps.
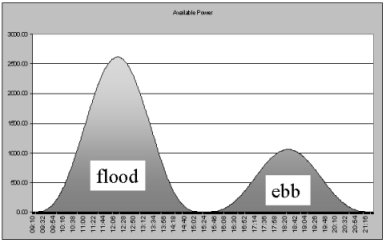
If our turbine only operated in one direction, we would only be able to exploit power from the flood component of the tide.
However, as the MCT turbine has full-pitch control which enables it to reverse the blades, the power from both components can be exploited as shown below.
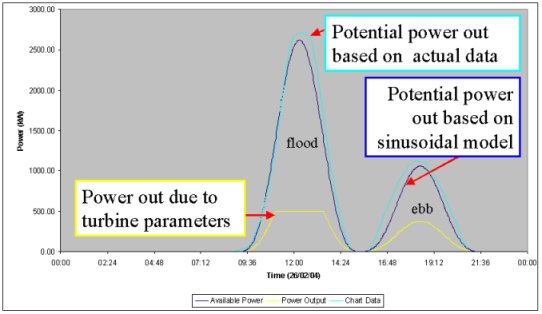
The graph below shows modelled data for an actual site. There are three power graphs:
- potential power based on actual site data
- potential power based on our sinusoidal model - reasonably close to the actual data
- actual power out from turbine - the flat area shows the rated speed
back to top
Rule of Twelfths
The "Rule of Twelfths" describes the varying power of the tide throughout its cycle. Assuming a semi-diurnal tidal cycle and a period of approximately 6 hours between LW and HW, then the rule states that in the:
- 1st hour after LW, 1 twelfth of the total water displaced travels.
- 2nd hour after LW, 2 twelfths of the total water displaced flows in.
- 3rd hour after, 3 twelfths of the total water displaced flows in.
- 4rd hour after, again 3 twelfths of the total water displaced flows in.
- 5th hour after, 2 twelfths of the total water travel in.
- 6th hour after, 1 twelfths comes in.
back to top
Observations
Despite the inherent predictability of tidal currents, we have identified a number of factors which will vary the behaviour of the tidal currents from our standard model. Wherever possible, errors have been calculated and stated alongside our results to ensure a robust analysis approach.
back to top
References
-
James Craig, AEA Technology (2003), Survey of energy Resources - TIDAL ENERGY, World Energy Council.
http://www.worldenergy.org/wec-geis/publications/reports/ser/tide/tide.asp - Met Office (2004), Data on Scottish Climate
http://www.met-office.gov.uk/climate/uk/location/scotland/winds.html
- Oceansonline.com (2002), Ride the Tide!
http://www.oceansonline.com/tides.htm
- Edward Lee-Elliot Ed. (2003), Reeds Nautical Almanac, Nautical Data.