G. Matching Analysis
|
Exercise
purpose: |
Run a matching analysis for a Merit project with previously defined climate data, demand, supply and auxiliary systems. |
|
|
|
|
1. Prepare matching
analysis. |
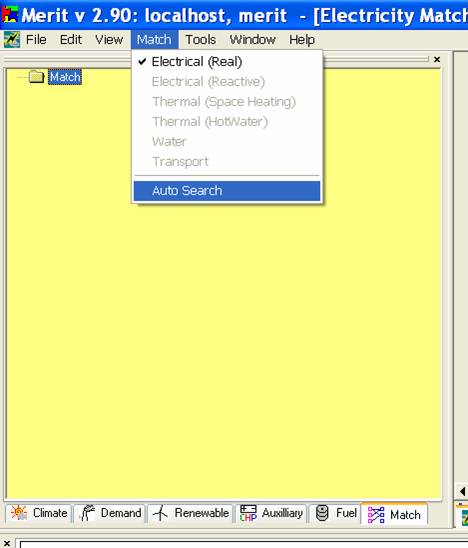
In order to
undertake a search for the best match between supply options and the demands,
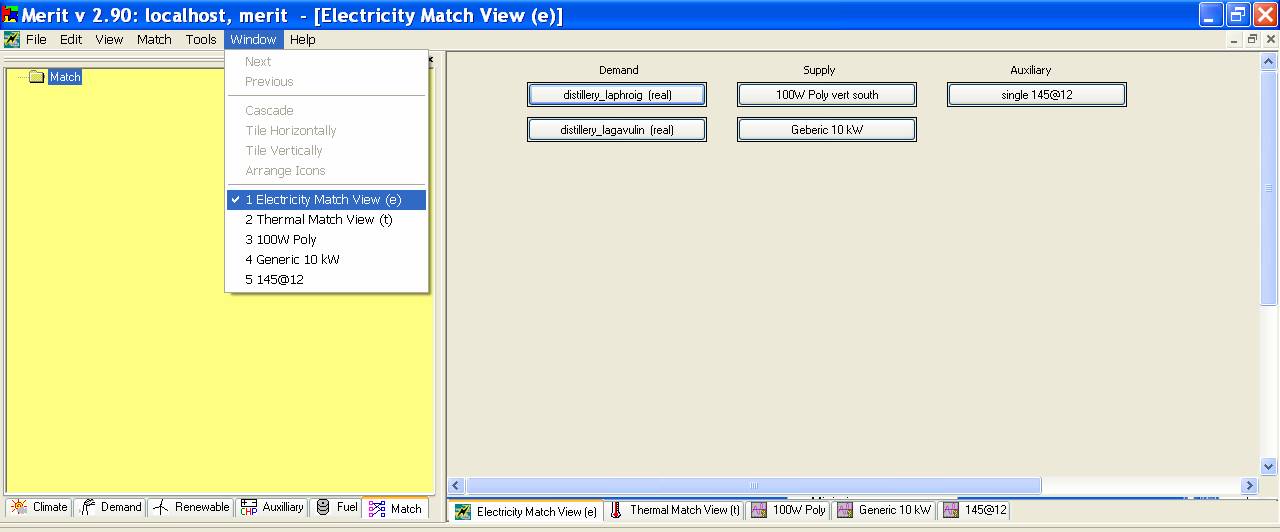
the Merit focus needs to be switched to matching. Find the Match
tab in the upper-left frame and click on this. Next, to find the electricity match view or the thermal match view in the
upper-right window frame, select the ‘Window’
menu in the main frame where you can see the list of sub-windows currently
activated in the upright window frame. When clicking ‘Electricity Match View (e)’ in the list as shown below, the Electricity Match view window will be focused in the upper-right frame and
it will be filled with buttons representing the current selected demand
profiles, selected supply components and the selected battery systems
specified in the previous exercises. The same for the Thermal Match View (t). Alternatively,
click the Electricity Match View (e)
tab or the Thermal Match View (t) in
the match view frame directly. (If the display is overly cluttered you
might want to minimise other sub-frames and resize the Merit display.)
|
|
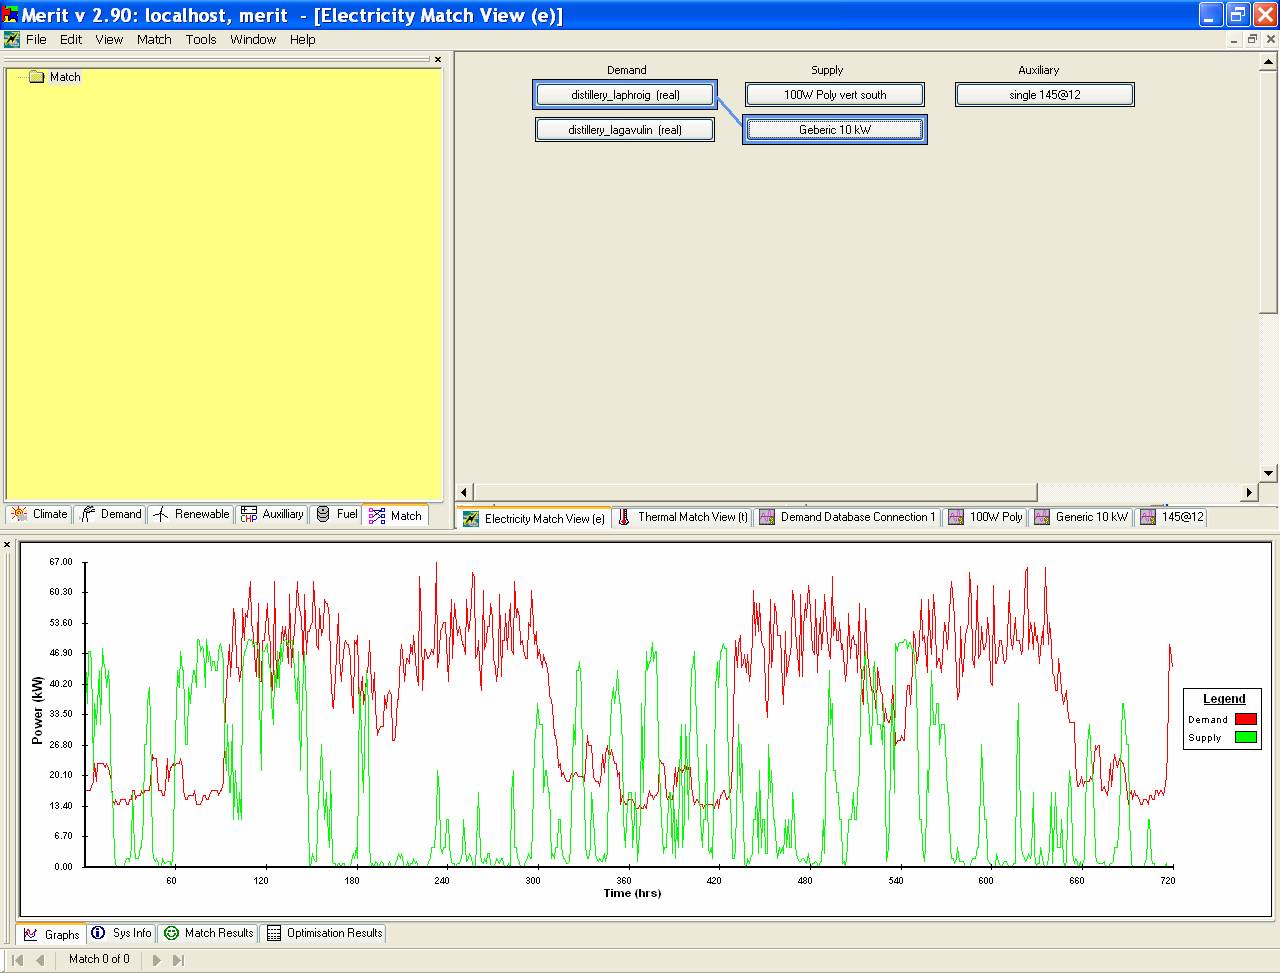
2. Manual matching. |
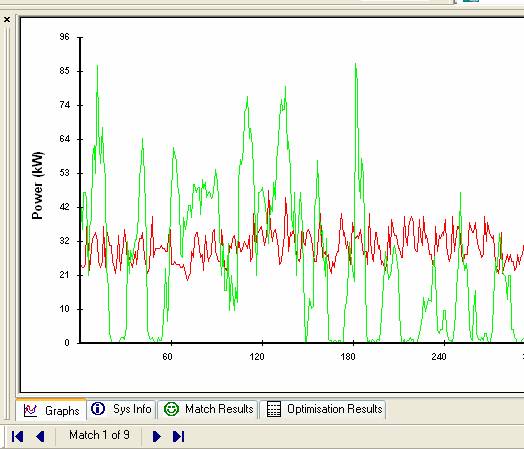
To test a match of a demand profile and a supply profile, you have to select (by clicking on the button representing the demand or supply) one or more demand and supply profiles to assess. For this exercise, click on the distillery_laphroig (real) button on the demand side and then click Generic 10 kW button on the supply side. Look in the bottom frame for the result of this user specified match. The buttons in the match view frame are toggled between selected/unselected. Every time a match of demand/supply gets established, the result of the match is presented graphically and with the associated match statistics.
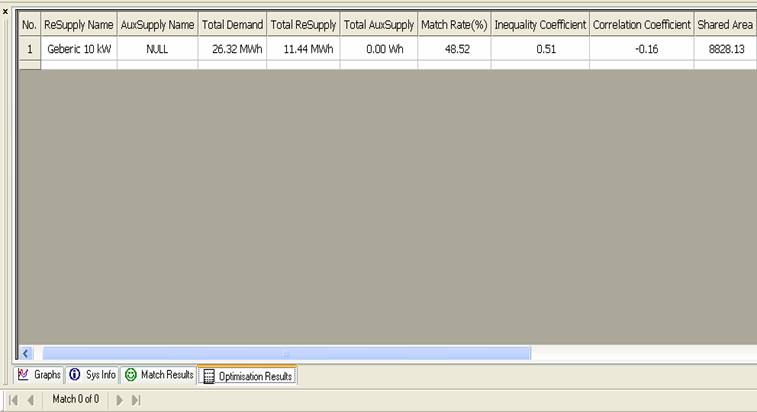
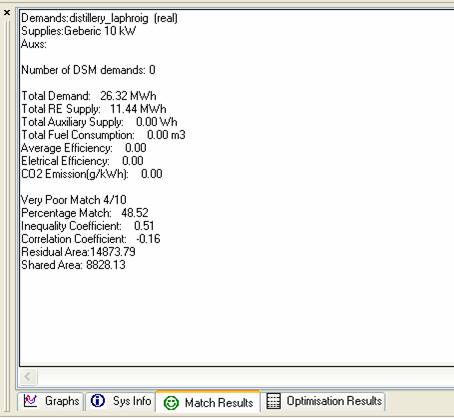
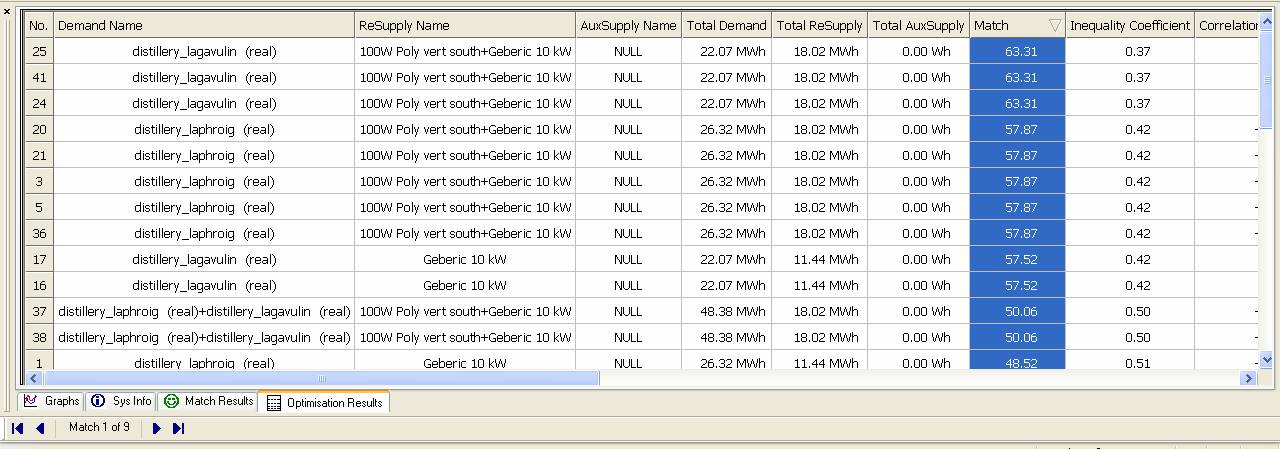
To see the statistical results of the match, click the Match Statistics tab at the base of the bottom frame or you can click the Optimisation Results tab to see the results. The latter option is used for analysing the match results when there are many demand and supply profiles. Various matching statistics are displayed at the bottom window and in the optimisation table. In practice you would probably capture these details for reference. (click here to see the brief discussion on matching indicators used in MERIT). Now try two supply options to make the problem a bit more interesting. Select distillery_laphroig (real) on the demand side and select 100W Poly vert south and Generic 10 kW on the supply side and see the graphical and statistical results. Continue to try the supply/demand matching with other demand options and battery system. You can change the period to zoom in the matching results by following the instructions described in Exercise C defining climate set and analysis period. The PV system will generate more energy supply in the spring and summer seasons than the winter season. Find out which season is the most favourable period for the renewable system matching the demand. |
|
|
|
|
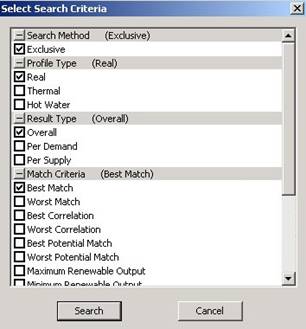
3. Auto search for the best match combination. |
The number of matching cases increases quickly as you add more demand/supply options. For example, 4 demand profiles and 2 supply profiles results in 30 possible matches while in the case of ‘per demand’ matching, the number of possible matches is ‘12’. A manual search for the best match among the cases can be avoided as Merit provides a facility to search for the best matching combination and rate. To activate the automatic search: Select Auto Search in the Match menu in the main window: a popup window titled Select Search Criteria includes options which you can switch on by clicking on the check boxes beside the sub-titles. For this exercise, use the defaults and press the Search button at the bottom of the popup window. After the automatic searching has completed, a combination of the best matching results will be presented in the Match view window using coloured lines (between the supply and demand buttons) as well as a graph of the supply and demand patterns over time and a brief report. The result of each matching can be viewed by clicking ◄ or ► buttons at the bottom of the graphs. Browse the results of all matching cases and compare them graphically and statistically.
|
|
|
|
|
|
|
|
Exercise result: |
You will have
undertaken a manual supply/demand match as well as an automatic search for
the best match from several supplies. |