G. Regression
Analysis
|
Exercise purpose: |
To become familiar with EnTrak's analysis tool for regression analysis. |
|
|
|
|
1. Open the analysis section dealing with lines of best fit. |
Choose 'Regression' from the 'Analysis' menu. |
|
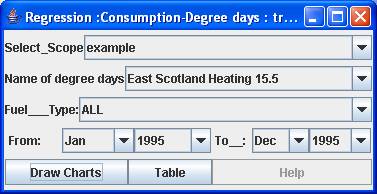
2. Set scope parameters. |
Choose 'Example' in the 'select_scope' menu. |
|
|
Choose 'East Scotland
Heating 15.5' in 'name of degree days' menu. Choose 'ALL' as the 'fuel_type'. Set the period as Jan1995 - December 1995 and click the 'Draw chart' button. |
|
|
|
|
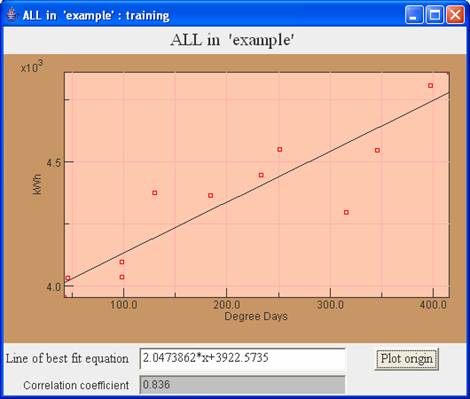
3. See the feature of regression line graph |
Click the 'Legend' button. You can zoom on an area by dragging the mouse on the graph. Note: if the button is not seen on the screen, resize to a larger window. |
|
|
|
|
4. Close all opened charts and tables. |
|
|
|
|
|
Exercise result: |
The ability to generate a graph showing a line of best fit graph and the associated equation. |