H. CUSUM
|
Exercise purpose: |
To become familiar with a CUSUM analysis. |
|
|
|
|
1. Open the CUSUM manager. |
Choose 'CUSUM' from the 'Analysis' menu. |
|
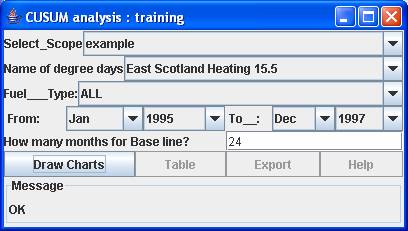
2. Set condition parameters. |
Choose 'Example' in the 'select_scope' menu. Choose 'East Scotland Heating 15.5' in the 'name of degree days ' menu. Choose 'ALL' as the 'fuel_type' and set the period to Jan 1995 - Dec 1997.
|
|
3. Set the duration for the base line calculation. |
To formulate the baseline,
set the number of months. For this exercise, set 24 months, which means that
the baseline is calculated using the period from January 1995 to December 1996.
|
|
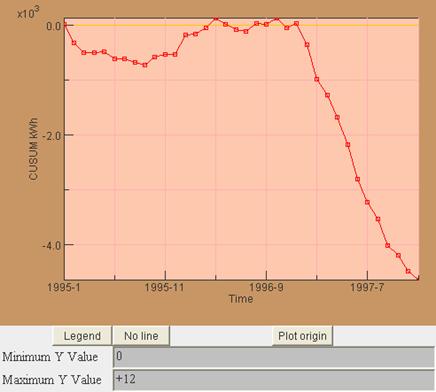
4. Draw the CUSUM graph |
Click the 'Draw Charts'
button.
|
|
|
Study the CUSUM graph and understand the meaning of the various parts of the plot where the slope changes. |
|
5. Close the opened graph. |
|
|
|
|
|
Exercise result: |
The ability to generate CUSUM graphs. |