E. Energy
Consumption Profiling
|
Exercise purpose: |
To present energy consumption data in various formats. |
|
|
|
|
1. Open the Energy Consumption Profile manager. |
Select 'Consumption' from the 'Profile' menu. |
|
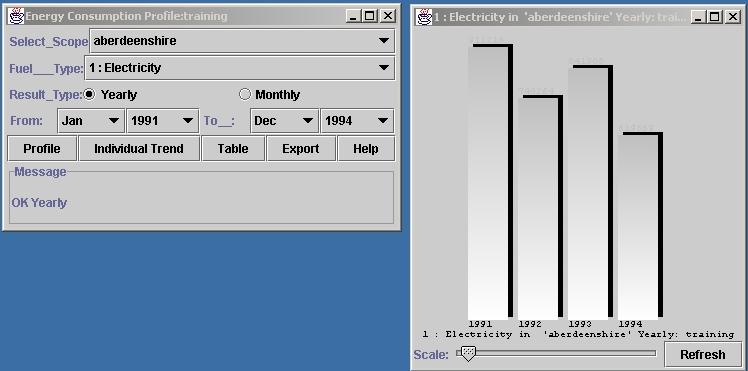
2. Make a yearly electricity consumption profile chart for the 'Aberdeenshire' scope. |
Select 'Aberdeenshire' in the 'select_scope' menu. |
|
|
Select 'Electricity' as the 'fuel_type'. Select 'Yearly' as the 'Result_type'. Select a period, e.g. Jan. 1991-Dec 1994. |
|
|
Click the 'profile' button
(see screen shot).
|
|
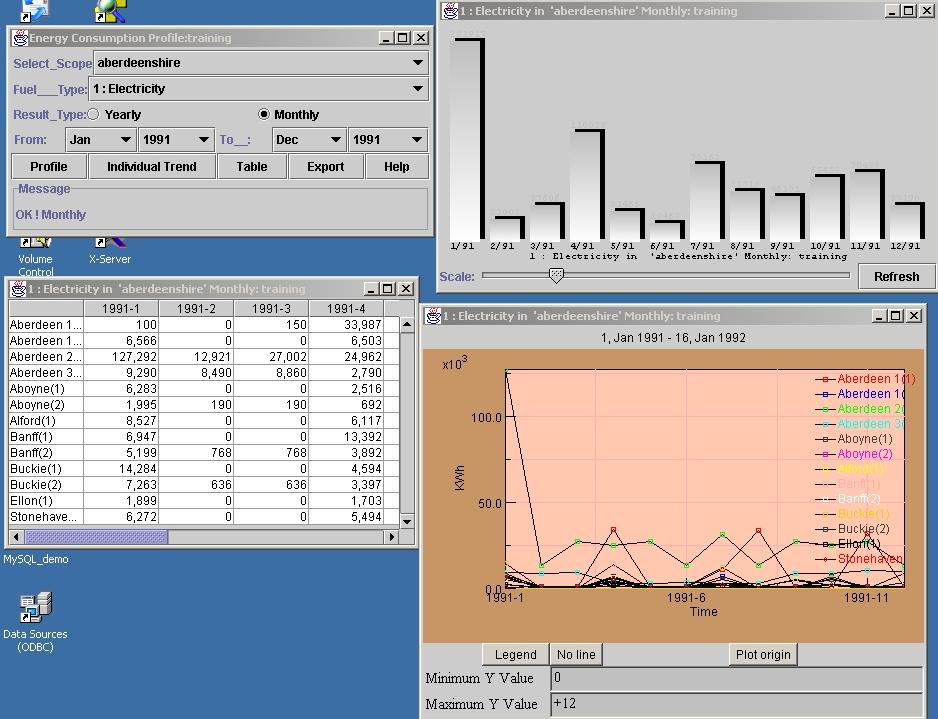
3. Make a monthly electricity consumption profile chart for the 'Aberdeenshire' scope. |
Select 'Monthly' as the 'Result_type'. |
|
4. See the feature of each display chart. |
Select a period, e.g. Jan. 1991 - Dec. 1991.
Click 'Profile' ,
'Individual Trend' and 'Table' (see screen shot).
|
|
|
|
|
5. Close all opened charts and tables. |
|
|
|
|
|
Exercise result: |
The ability to make energy consumption profile charts . |

