Data Collected
We collected a record of over 400 failures in the UK between the years 2003 and 2007. These failures consisted mostly of blade failure, gearbox failure, generator failure, but the data also showed structural, yaw mechanism, and other failures. These failures were recorded at 39 different wind farms. The graphs below show the breakdown of the failures by component and by site.
Failures by Component
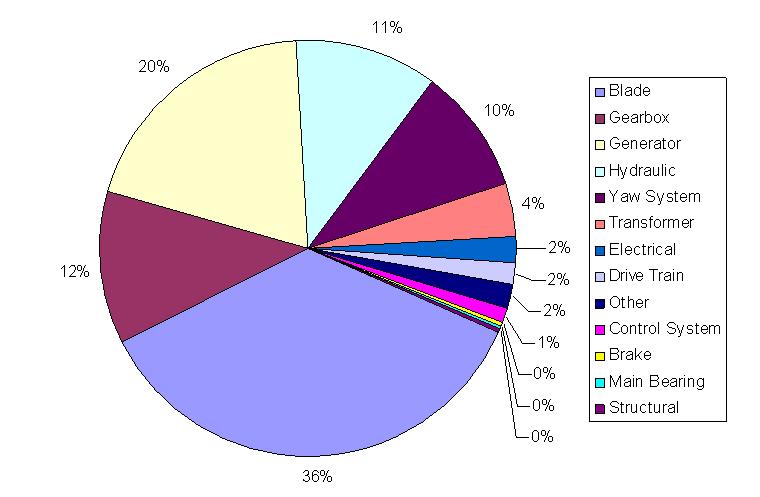
The graph above shows all the failures in the database broken down by main component failure type. With 36 percent of all failures, blade failures are the most common, followed by generator failures making up 20 percent of the failure database. Gearbox failures make up 12 percent of the failures, as the third most common component failure.

The graph above shows a ratio of the number of failures to the number of turbines on each site. The graph shows a great deal of variability between sites. For example, site 33 has a ratio close to 2.25, while site 17 has a ratio barely above zero. The sites with ratios greater than one are considered the poorer performers of the wind farm sites. In some cases, the number of failures may include multiple component failures on a single turbine. This may explain the ratios that are greater than one. On these sites, every turbine may not have failed, but there were more individual components than there were turbines on site.
Wind Turbine Failure Data
The failure database below includes the raw data the group had access to for the data analysis. The database also includes a summary of characteristics by site, taken from the list of individual failures. Download the Database (Microsoft Excel format, 121 KB)