|
| |
|
For our project, a
study and an approximation of the energy use is necessary to first
understand the actual use of the energy. Due to this, the following
report shows the current use of the energy on the construction
village selected on this project.
At present, it is
not possible to describe how the energy is being used in every cabin
because there are not available data. The data that could be
extracted by measuring that on the time of this project would not be
enough to extrapolate it. For that, an estimation according to the
heaters, lighters and other equipment existed in the construction
site has been done. Also some figures have been used from
documentation given by LORS.
Back to Top
The objectives of
this study are to determinate the current demand profile in terms
of:
1.
power
installed (Watts)
2.
energy use
(kWh)
It is important to
remark that the following calculations are only available in terms
of a simulation. Also, the winter
season has been chosen for analysis as is the most exigent in energy
use so will determine the maximum energy that must be supply to the
site. This would be useful in further analysis of this project to
improve the energy efficiency of the site.
Back to Top
|
|
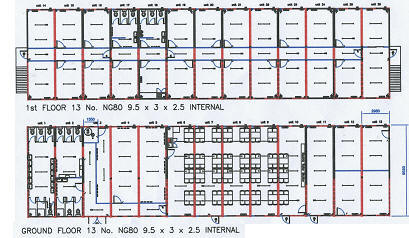
The layout of the
cabins of the construction village (not contractors) is shown in the
right figure. As it can be shown cabins from the first and ground
floor are drawn from the top perspective.
From the right to
the left on the first floor on the picture starting from the stairs,
the cabins are used for allocate the administration office, several
offices, meeting room and services.
On the other hand,
from the right to the left on the ground floor on the picture, the
cabins are used for allocate the kitchen, the canteen room, the
drying room and finally the toilets.
|
 |
|
|
Figure of Current
layout of the Xscape site construction villages.
Back to Top |
|
The following figures have been obtained considering the
actual devices that are used in the construction site according to
the visits. The results are expressed in terms of Power (W).
It has been considered according to the following
classifications:
¾
Heaters: those are the 2 kW electric convector heaters
controlled by on-off switches and by thermostats; the 150 W
electric cylindrical heaters; and the water heaters for the
worker accommodation of 6 kW and 3 kW for the kitchen.
¾
Lights: it is considered the 36 W fluorescent lamps, 58 W
fluorescent lamps, 58 W of emergency lights and 1 kW of
external lights.
¾
Equipment: it is considered electrical devices such as laptops,
TFT, PC tower, microwave, fridge and others used to heat meals.
|
| |
|
|
|
|
|
|
|
|
Actual power
installed |
|
Back to Top |
|
|
|
The actual
situation of the use of energy on the site according to every type
of room and theirs hours of use can be shown in the figures below.
|
 |
|
Some assumptions
have been considered:
- Energy use profile at winter time as the worst case when more
energy is required.
-
Outside lighting starts at 5:00pm.
- Canteen
heater devices i.e. microwave are used on the break periods of
the workers, this time will be shown in following figures.
Next figures show the profile of energy use, note that it
does not correspond with the occupancy level that is due to no
controls on energy use.
|
|
|
From the above
figures a brief analysis on the use of energy can be done:
§
Analysis of the heating use:
Figure shows a basic need for heating load along the
non-working time of 5.2 kW which will correspond to the drying
room and an average consumption along the day of 110kW which
will correspond to the heat demand of the site along the day.
§
Analysis of the lighting use:
The lighting
level is about 8.3 kW along the day and a basic consumption of
3kW corresponding to the outside lights is kept from 5pm to 7am
next day, thus some peaks appears on the period that outside
lights are on mean workers are still on the site.
§
Analysis of the equipment use:
A basic consumption of about 5kW is maintained along the day
corresponding to the equipment used in the offices, i.e. laptops,
PC, TFT. Major peaks of about 10kW corresponding at the time
than heater devices are used on the canteen appears on the some
periods along the day.
Back to Top
|
|
The following
figures shows how the energy use along the day could be easily
reduced by using the energy just on the time is required. For
this assumption, the energy use will be plotted considering the
occupancy levels.
In the same way
that past paragraph, some assumptions have been considered:
-
Energy use
profile at winter time as the worst case when more energy is
required.
-
Outside
lighting starts at 5:00pm.
Some considerations must be noticed:
-
Office type
1 shows that kind of offices used by staff working outside
on the building site, so level of occupancy have been
considered assuming the following times in the offices: on
the first hours of the day, some time around the noon and
some final time before leaving.
-
Office type
2 shows that kind of offices used by staff working indoor
the whole day as a typical office work.
-
Meeting
rooms have been considered with an occupancy level similar
at office type 1.
-
Contractor’s cabins have been considered with an occupancy
level similar at office type 1.
-
Canteen has
been considered with an occupancy level similar at office
type 1.
-
Toilets
have been considered that just the 45v% of the time would be
used.
|
|
|
From the above
figures, some differences can be shown with respect to previous
analysis:
§
Analysis of the heating use:
A basic consumption of about 50kW along the day due to the
rooms type 1 and an amount of 5.2kW along the non-working time
is maintained. Some peaks that correspond with the break times
when workers and staff goes to their rooms type 2 can be also
seen in the graph. A reduction of a 27% consumption could be
obtained following this basic control with respect to the actual
situation.
§
Analysis of the lighting use:
The profile of energy use for lighting follows the same
considerations that the one mentioned on the heating use. A
reduction of a 26% consumption could be obtained on this case.
§
Analysis of the equipment use:
Considering some basic control a reduction of 11% of the
consumption could be gained. Special reduction will be due to the
control of rooms types 1. |
| 
|
|
Back to Top
In this report,
a study of the actual situation of the energy use has been
described and a basic assumption of controlling the energy use
is studied to foresee the benefits of implementing those
measures in the construction villages. A total reduction of 26% of the energy consumption could
be obtained under this rough analysis by implementing control
measures.
This report
will be used in the next study in identifying demand improvement
measures for a
specific high energy demand areas in a construction village. This
methodology could be implemented for construction villages
preferably using actual measured data.
Back to Top
 |
|
